Novo Nordisk's Planned Production Boost Gives the Stock a Lift
Shares of the company behind Ozempic and Wegovy have more than doubled in the past 12 months.
You've reached your free article limit
You've read 0 of 1 free Pro articles.
The global healthcare company Novo Nordisk NVO has been in a strong technical advance the past three years. The company is known for leading positions within diabetes care, obesity care, hemophiliac care, and therapies for rare endocrine disorders, with blockbuster drugs Ozempic and Wegovy.
On Tuesday the company announced plans to invest $4.1 billion to build a second fill and finishing manufacturing facility in North Carolina, and grow its ability to produce current and future injectable treatments.
Let's check out the charts and indicators.
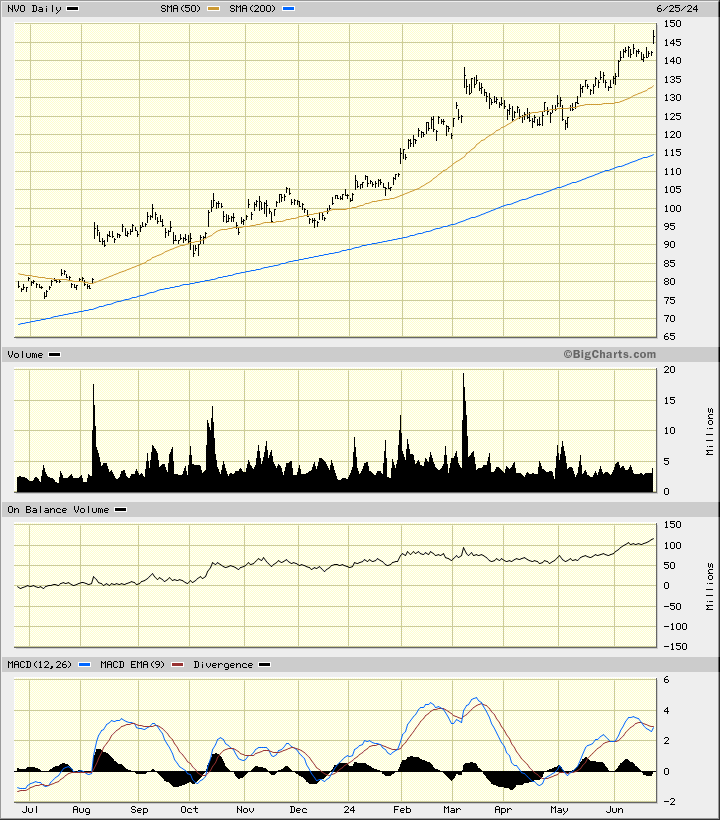
In the daily bar chart of NVO, below, I can see that the shares have more than doubled in the past 12 months. NVO trades above the rising 50-day moving average line and above the rising 200-day line.
The trading volume does not show us a pattern of increasing volume but the On-Balance-Volume (OBV0 line is in an uptrend. The Moving Average Convergence Divergence (MACD) oscillator is above the zero line but making a lower high than the one made in March.
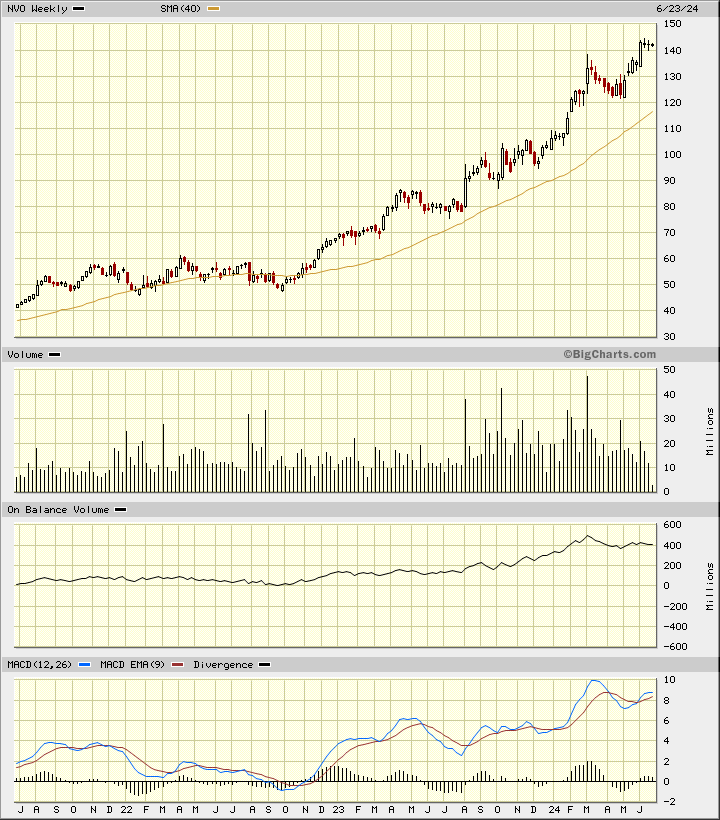
In the weekly Japanese candlestick chart of NVO, below, I can see that the shares have tripled in the past three years. Impressive advance.
NVO trades above the rising 40-week moving average line and the weekly OBV line is positive but off its best levels and so is the MACD oscillator. The most recent weekly candles have small real bodies or could be considered doji so they need to be watched for a possible top reversal pattern.
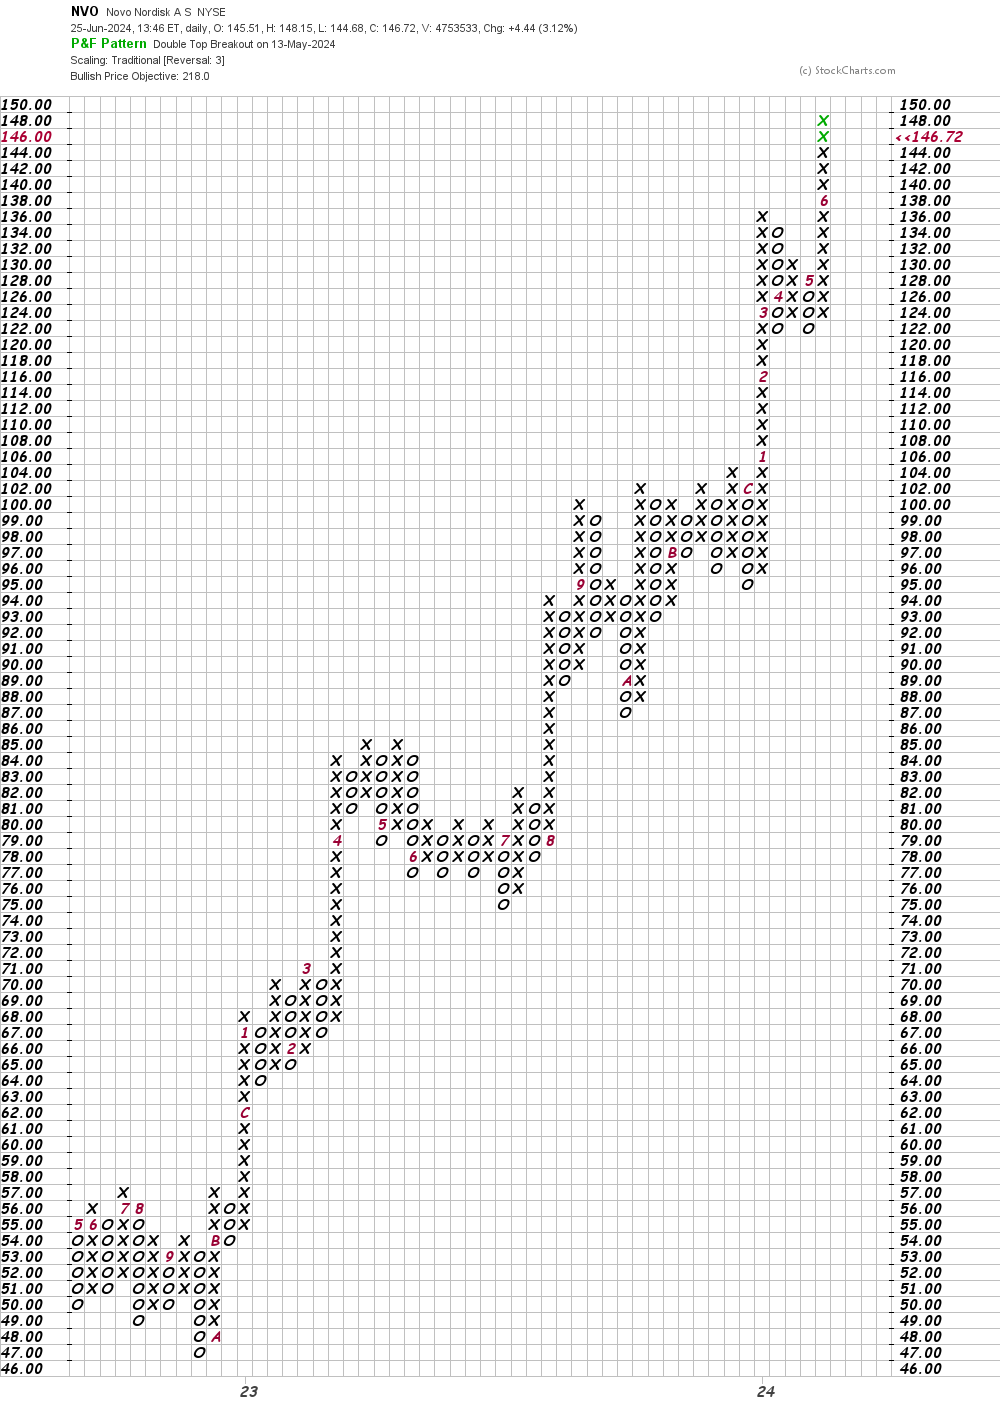
In this daily Point and Figure chart of NVO, below, I can see a potential price target in the $218 area.
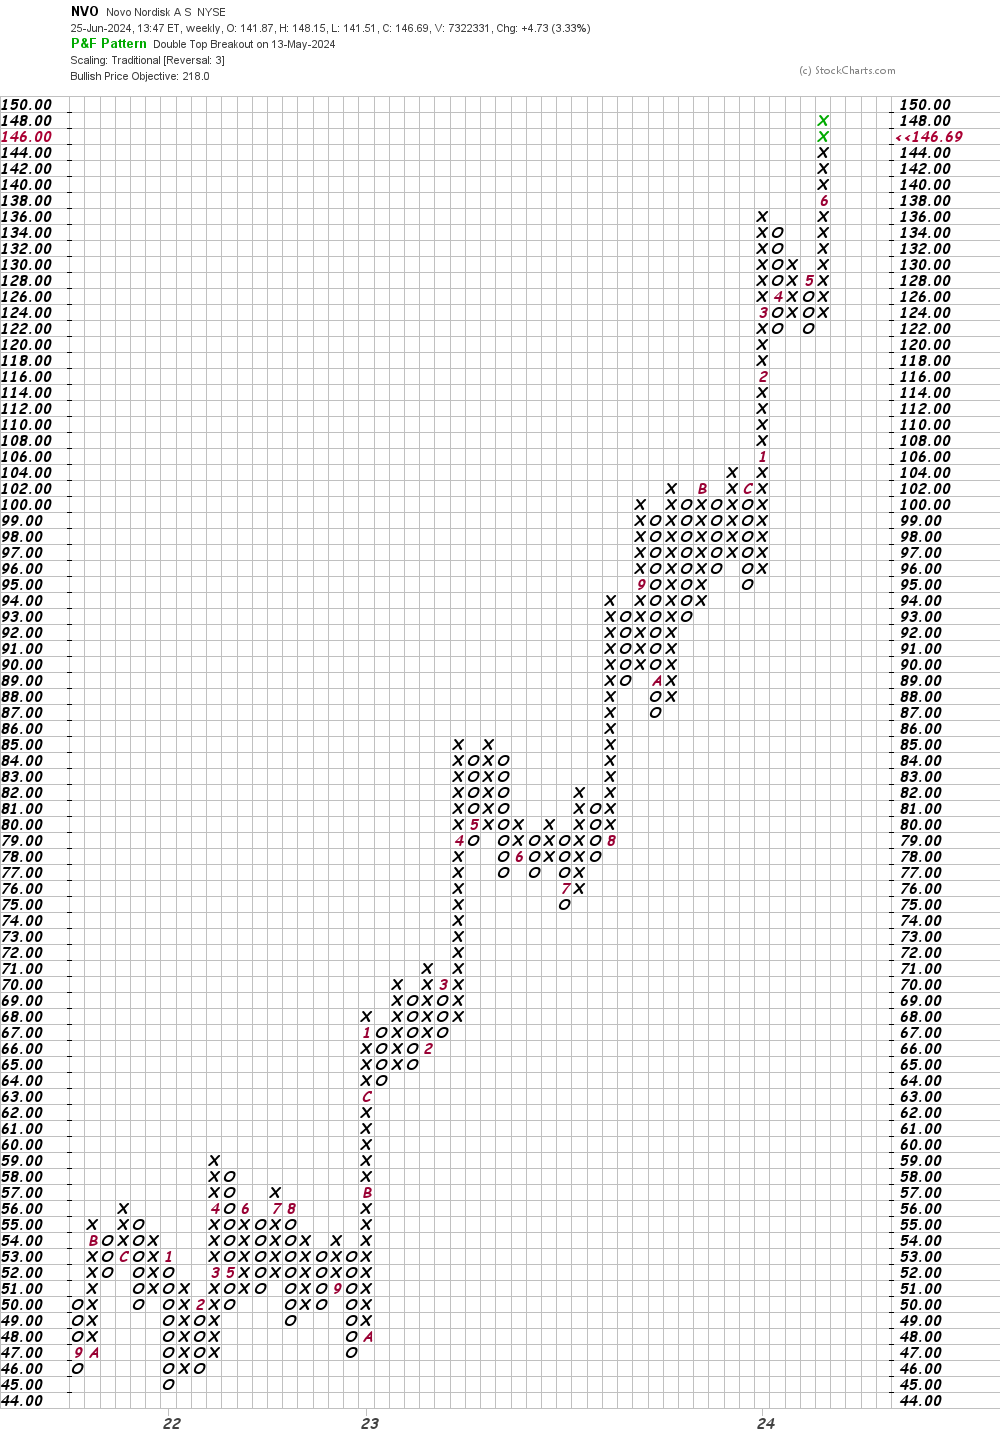
In this second Point and Figure chart of NVO, below, I used weekly price data and here the software shows us a price target of $218 like the daily chart above.
Bottom-line strategy: NVO is extended when compared to its 200-day moving average line so traders looking to go long NVO should wait for a shallow pullback. Risk to $135.
Employees of TheStreet are prohibited from trading individual securities.