This Biotech Giant Seems Poised for a Downside Move
Moderna has seen a price pullback since our last update, but traders should keep waiting for a better buying opportunity.
You've reached your free article limit
You've read 0 of 1 free Pro articles.
Moderna MRNA is a biotechnology company that develops mRNA-based medicines. It became a household name during the COVID-19 pandemic. In my May 26, 2024 review of MRNA, I noted that a correction or pullback was imminent.
"After the gains of the past two months MRNA shares need to correct or pull back," I wrote. "Corrections need to have a price pullback and they also need some time for shares to unwind the gains. Traders should stand aside from MRNA for a few weeks to let this pullback play out."
Let's pay another visit to the charts and indicators.
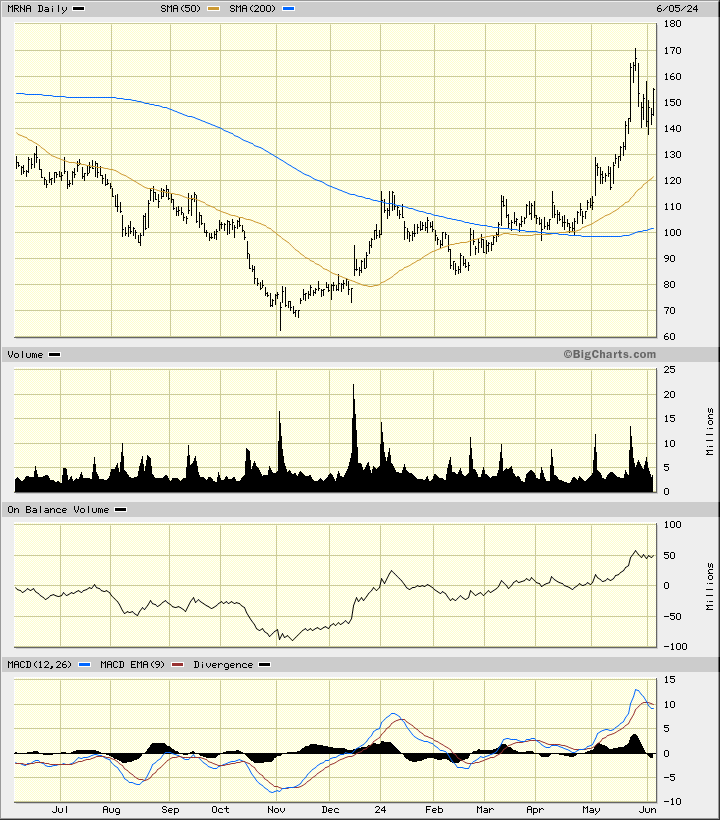
In this updated daily bar chart of MRNA below, I can see that prices did pull back after our update. Prices retraced about $30 in gains, so the question now is whether we should approach the long side of MRNA.
Prices trade above the rising 50-day moving average line and above the rising 200-day moving average line. The trading volume looks like it has been more active since December 2023. The On-Balance-Volume (OBV) line has been moving higher since early November and tells me that buyers of MRNA have been more aggressive than sellers. The Moving Average Convergence Divergence (MACD) oscillator is above the zero line but has started a downside correction.
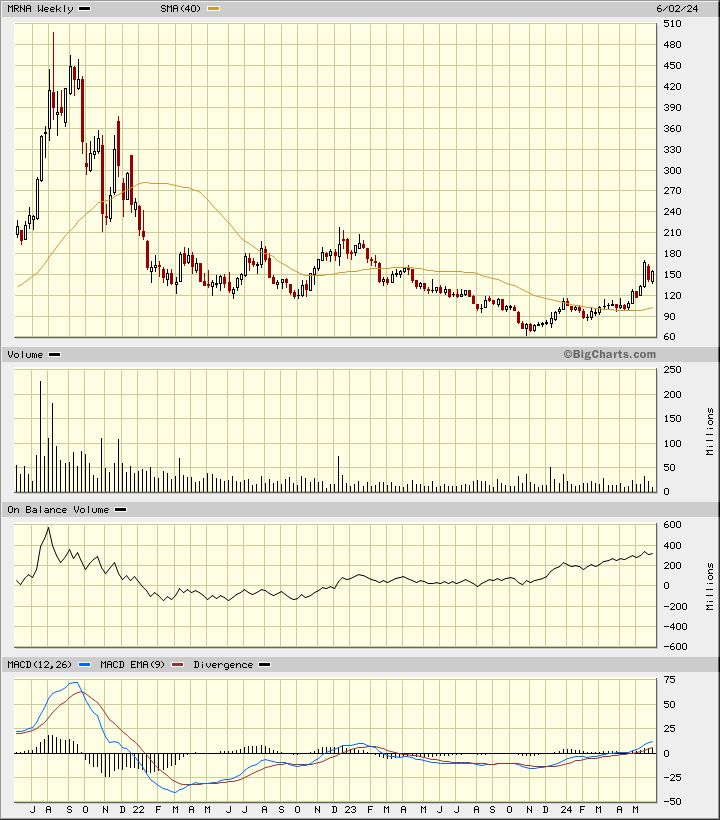
In this weekly Japanese candlestick chart of MRNA below, I see a developing bullish pattern. Prices trade above the rising 40-week moving average line but I would not rule out a retest of that indicator in the weeks ahead. The weekly OBV line is two years old and going strong. The MACD oscillator is now above the zero line giving us a buy signal.
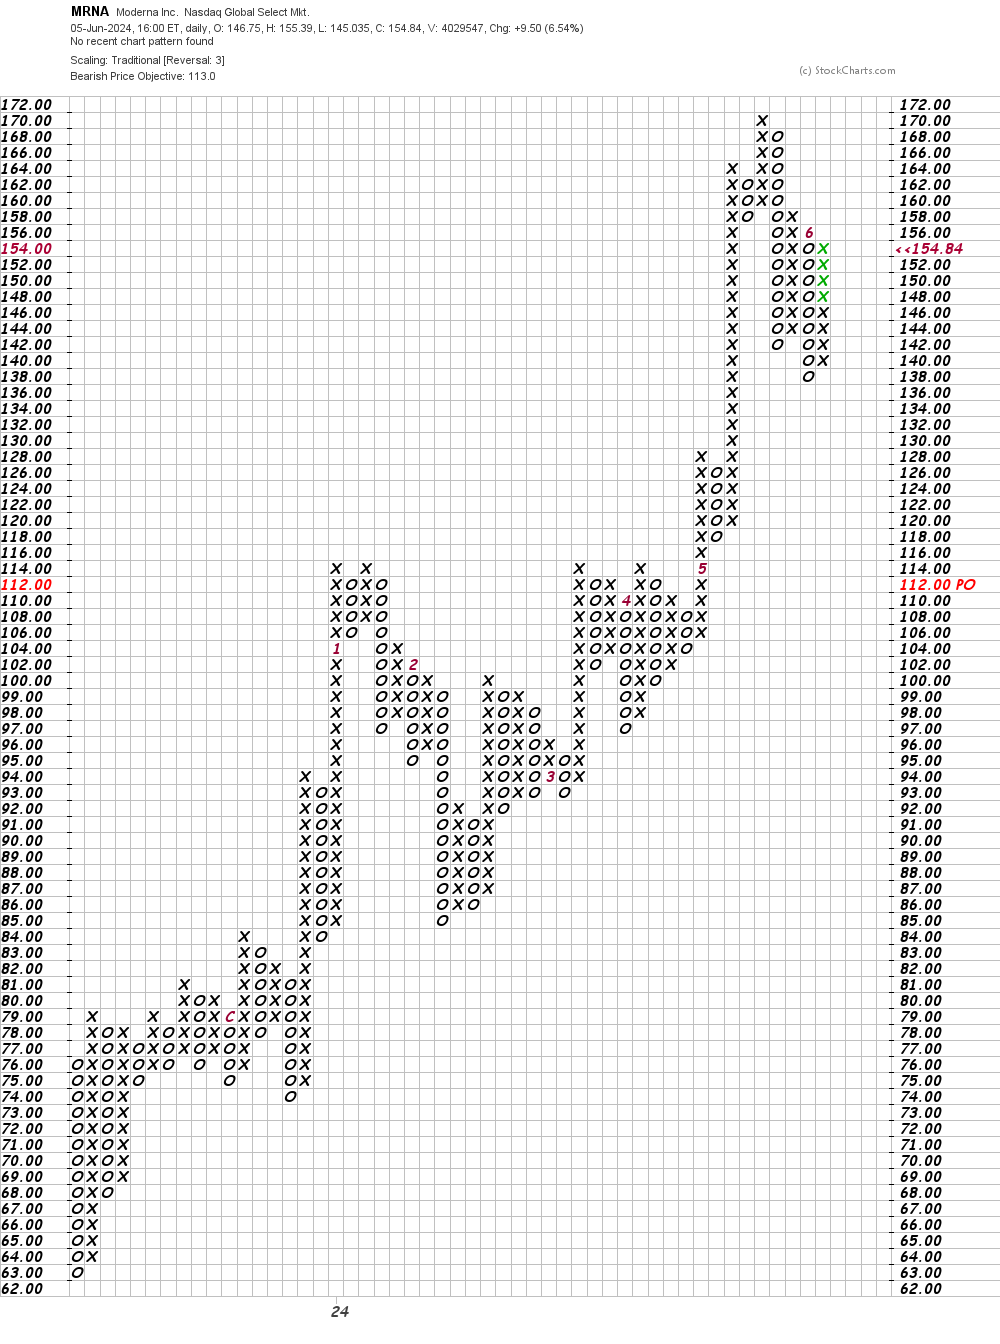
In this daily Point and Figure chart of MRNA below, I can see a potential downside price target in the $113 area.
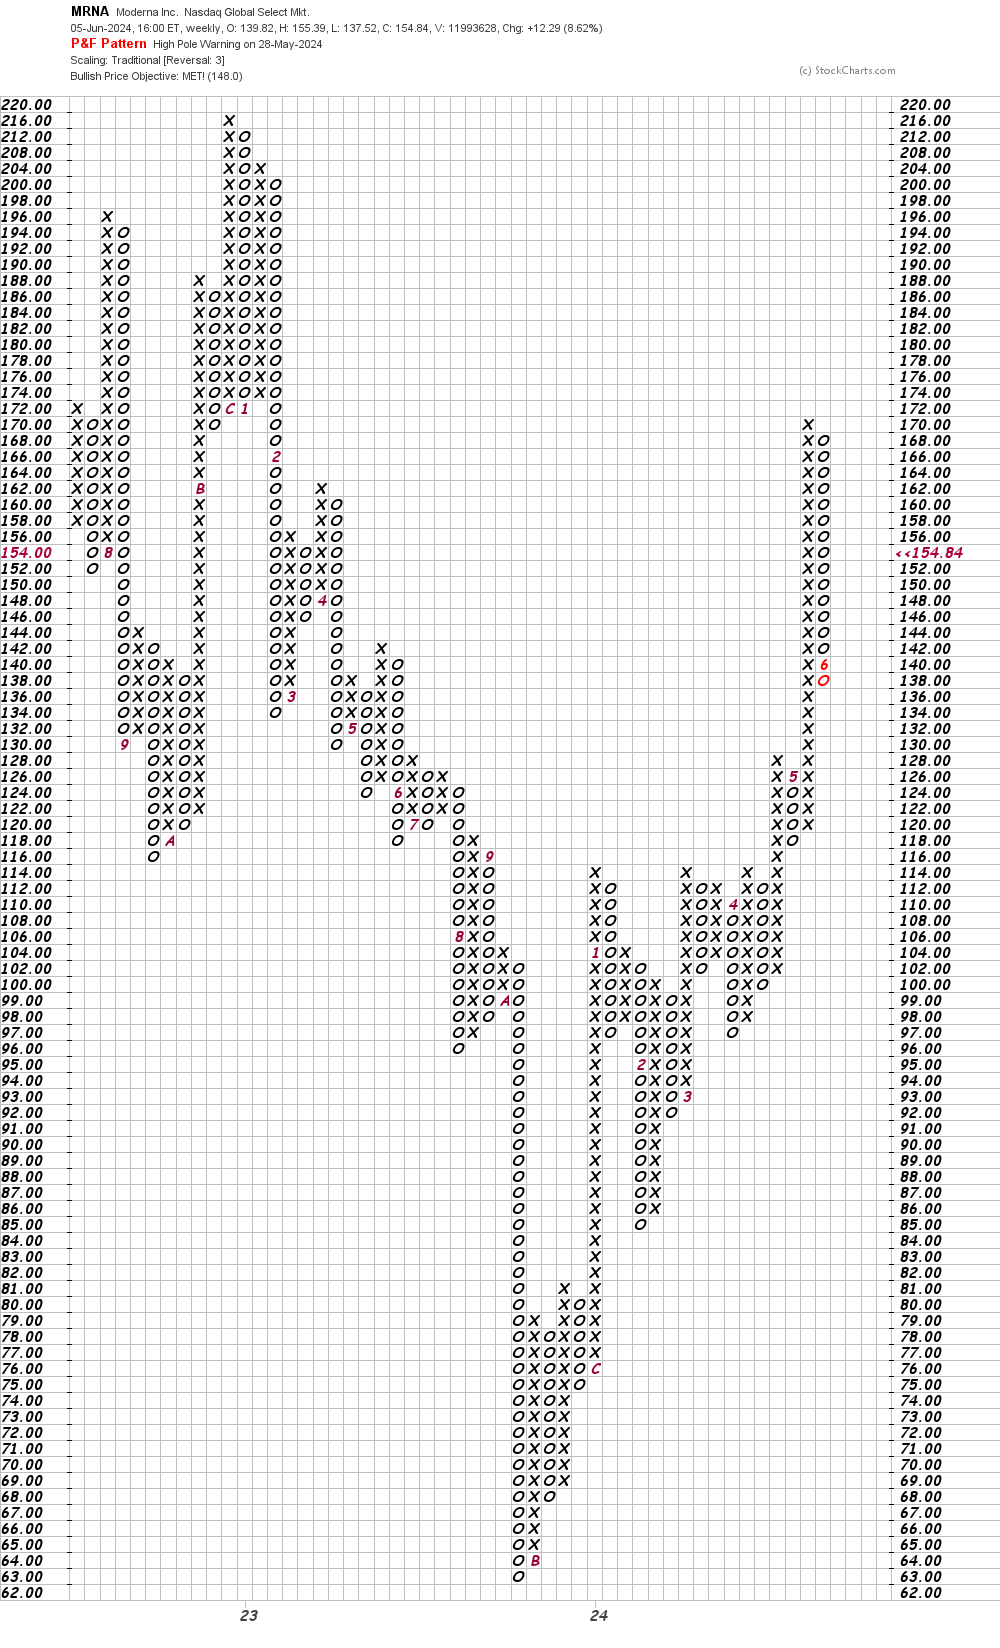
In this second Point and Figure chart of MRNA below, I used weekly price data. Here, the software tells us that prices have reached and exceeded a price target in the $148 area.
Bottom line strategy: Shares of MRNA have made a correction but it is not clear to me that the pullback is finished. Another downside move could develop in the weeks ahead. I would wait for a better buying opportunity.
Employees of TheStreet are prohibited from trading individual securities.