Marvell Could Stage a Breakout Sooner Than Later: Here's When to Buy
After looking at the chipmaker's charts and indicators this is our strategy.
You've reached your free article limit
You've read 0 of 1 free Pro articles.
Semiconductor manufacturer Marvell Technology MRVL has been trading sideways since January. The shares are not likely to stay in this sideways limbo forever, so let's check out the charts and indicators for clues on this holding in TheStreet Pro Portfolio.
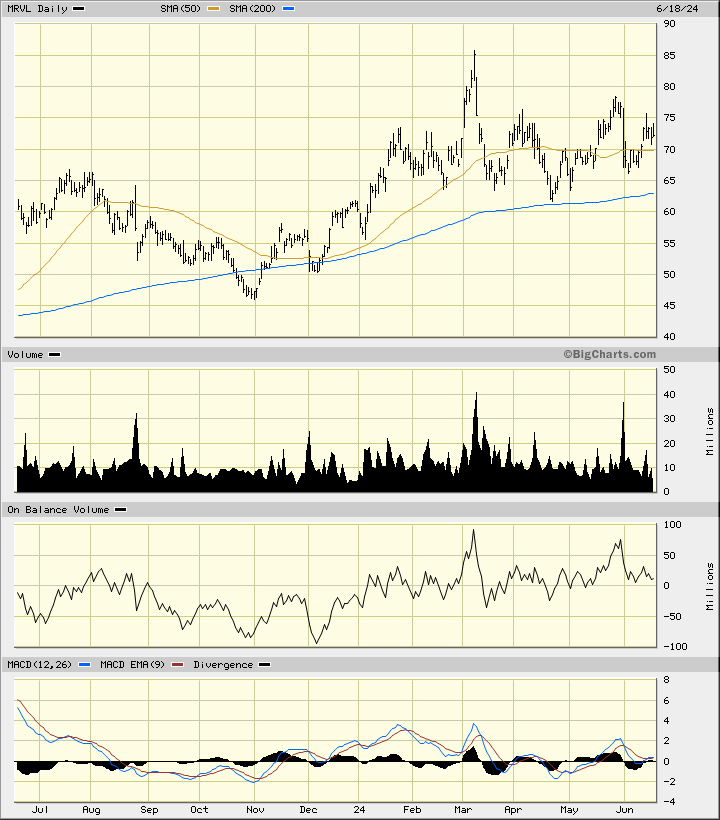
In the daily bar chart of MRVL, below, I can see that prices have traded sideways in a choppy affair. The shares have traded around the 50-day moving average line which has largely remained flat. The slope of the 200-day moving average line has also moved in a choppy range since December.
The daily On-Balance-Volume (OBV) line has moved sideways since late March telling me that MRVL has lacked "trend strength."
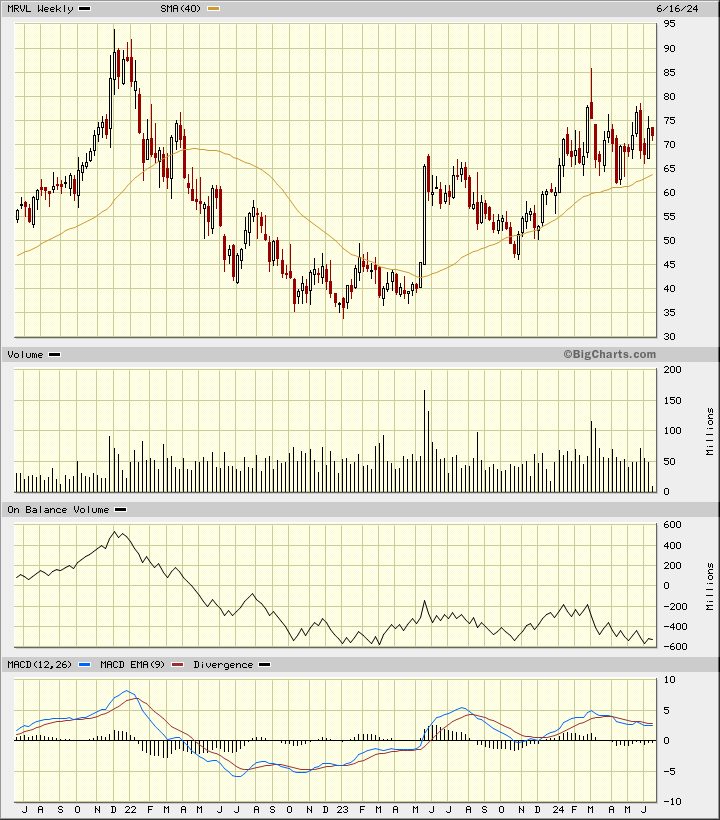
In the weekly Japanese candlestick chart of MRVL, below, I see a mixed picture. Prices are trading above the rising 40-week moving average line but prices have not made upwards progress in weeks.
The trading volume is neutral and the weekly OBV line has struggled the past two years. The MACD oscillator has been correcting lower since early March.
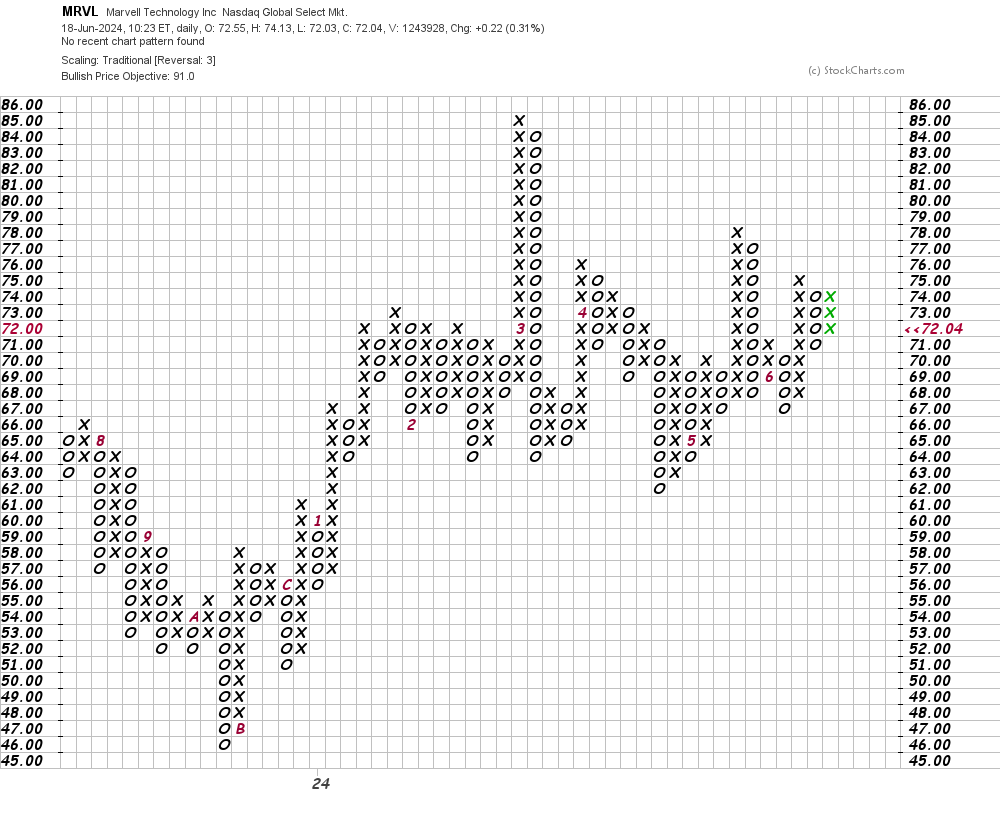
In this daily Point and Figure chart of MRVL, below, the software has looked at the X's and O's and decided on an upside price target in the $91 area.
In this weekly Point and Figure chart of MRVL, below, I can see a potential price target in the $110 area.
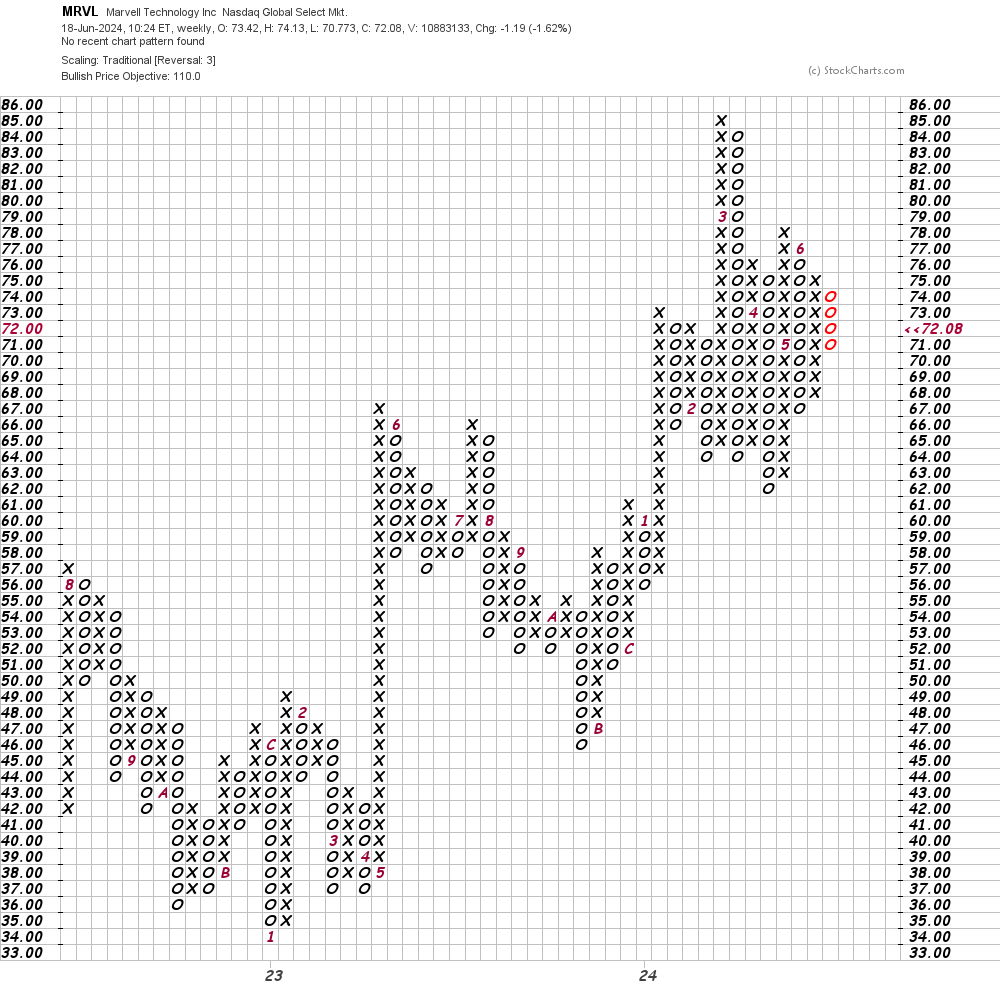
Bottom-line strategy: MRVL may continue to trade sideways so I would prefer to go long on strength above $79 instead of sitting and waiting for a move higher. Risk to $69 after going long above $79. The $110 area is my price target for now.
Employees of TheStreet are prohibited from trading individual securities.