Lowe's Could Use a Fix
The home improvement giant saw revenue miss by $370 million and cut its forward guidance, with further weakness likely.
You've reached your free article limit
You've read 0 of 1 free Pro articles.
Lowe's LOW reported a non-GAAP EPS of $4.10 on Tuesday, which beat estimates by $0.10 but revenue of $23.59 billion missed by $370 million. Lowe's also cut their forward guidance due to soft do-it-yourself demand.
Let's check out the charts and indicators.
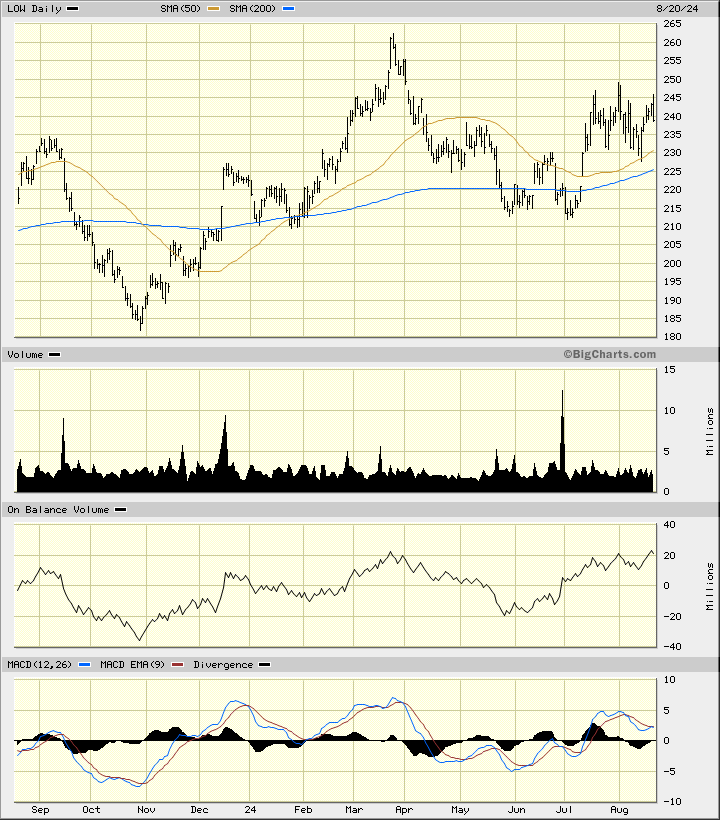
In this daily bar chart of LOW below, one has to look closely to see today's outside day and potential lower close. Older futures traders consider outside days and lower closes as powerful reversal patterns. Prices are trading above the rising 50-day moving average line and above the rising 200-day moving average line. The daily On-Balance-Volume (OBV) line has been improving the past three months. The Moving Average Convergence Divergence (MACD) oscillator is in a bullish alignment above the zero line.
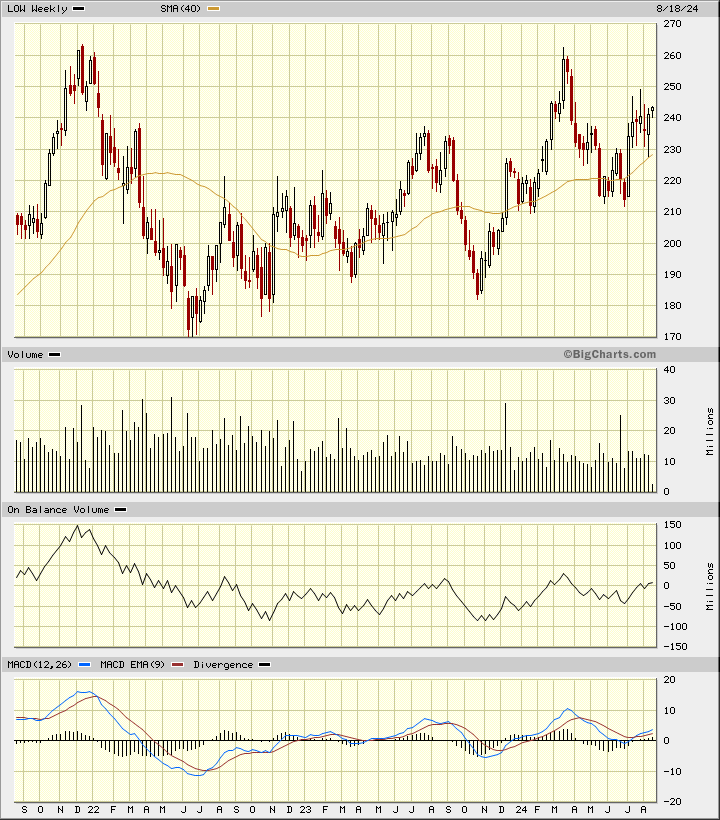
In this weekly Japanese candlestick chart of LOW below, I can see a picture that is still generally positive. Prices trade above the rising 40-week moving average line. The weekly trading volume and the OBV line look neutral here. The MACD oscillator is just slightly above the zero line. I can see some upper shadows on the candles in July and the latest candle pattern is a small spinning top. A weak candle this week could give us a top reversal pattern.
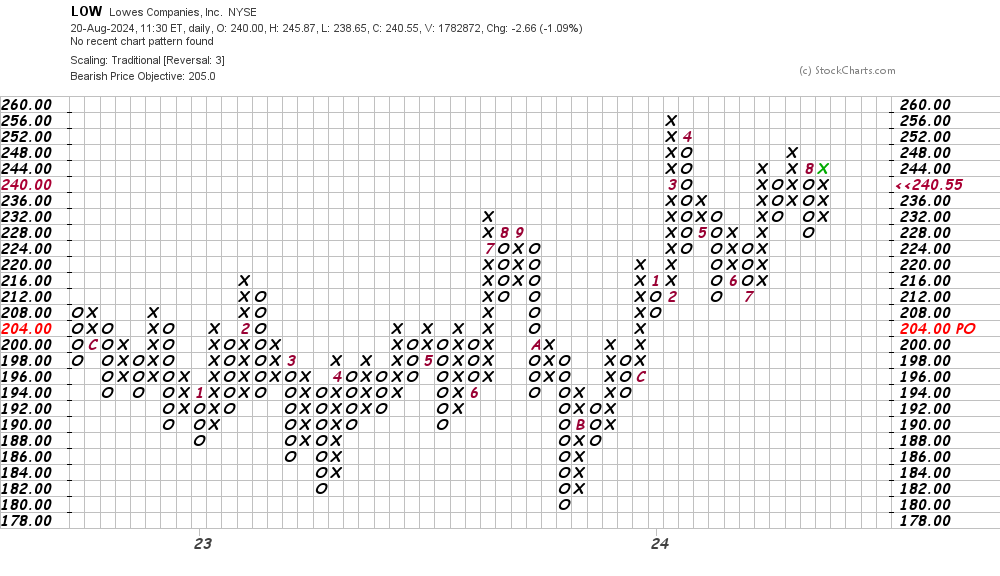
In this daily Point and Figure chart of LOW below, I can see a potential downside price target in the $205 area.
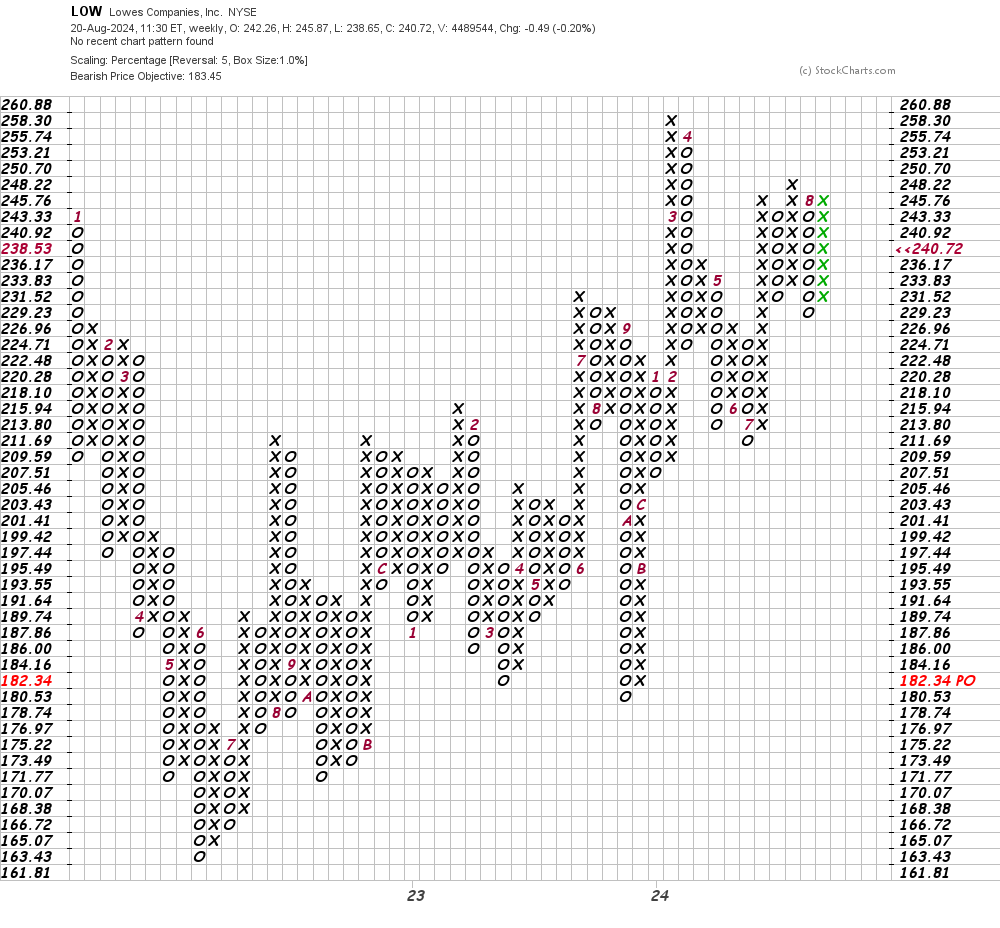
In this weekly Point and Figure chart of LOW below, I can see a downside price target in the $183 area.
Bottom line strategy: I have no strong recommendation for LOW but weakness below $224 is likely to precipitate further declines.
Employees of TheStreet are prohibited from trading individual securities.