Looking for Inspiration From Pinterest
The stock declined despite an earnings beat, so what's going on here?
You've reached your free article limit
You've read 0 of 1 free Pro articles.
On Tuesday night Pinterest PINS reported quarterly earnings, with non-GAAP EPS of $0.29 beating estimates by $0.01 and revenue of $853.68 million beating by $5.55 million.
PINS declined sharply Wednesday despite their earnings beat, so let's check out the charts and indicators.
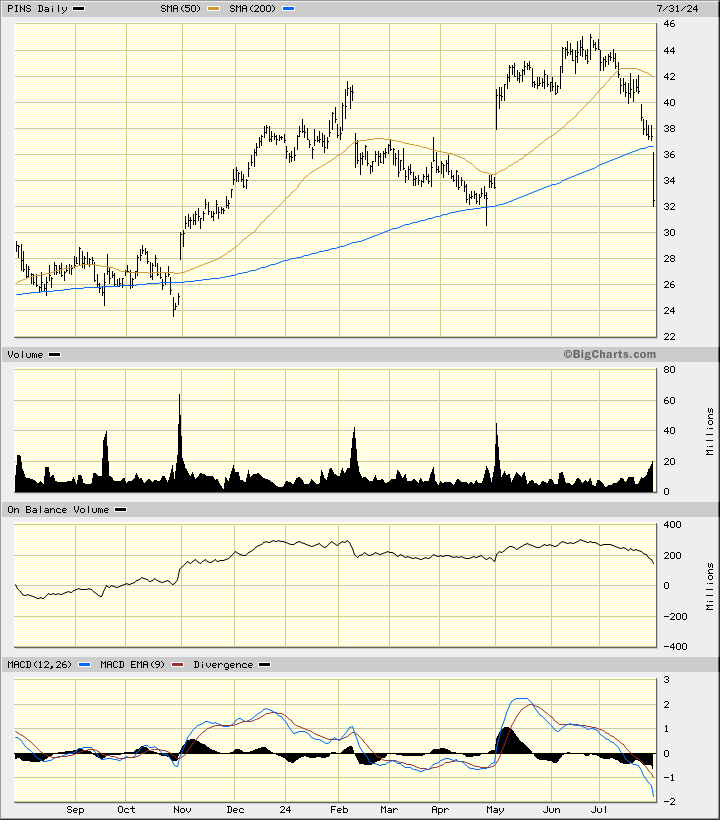
In the daily bar chart of PINS, below, I can see that the shares have gapped lower Wednesday. Prices gapped below the rising 200-day moving average line. The April price lows are being tested. The slope of the 50-day moving average line is negative.
The On-Balance-Volume (OBV) line made a high in June and has declined into the end of July. The trend-following Moving Average Convergence Divergence (MACD) oscillator is in a bearish alignment below the zero line.
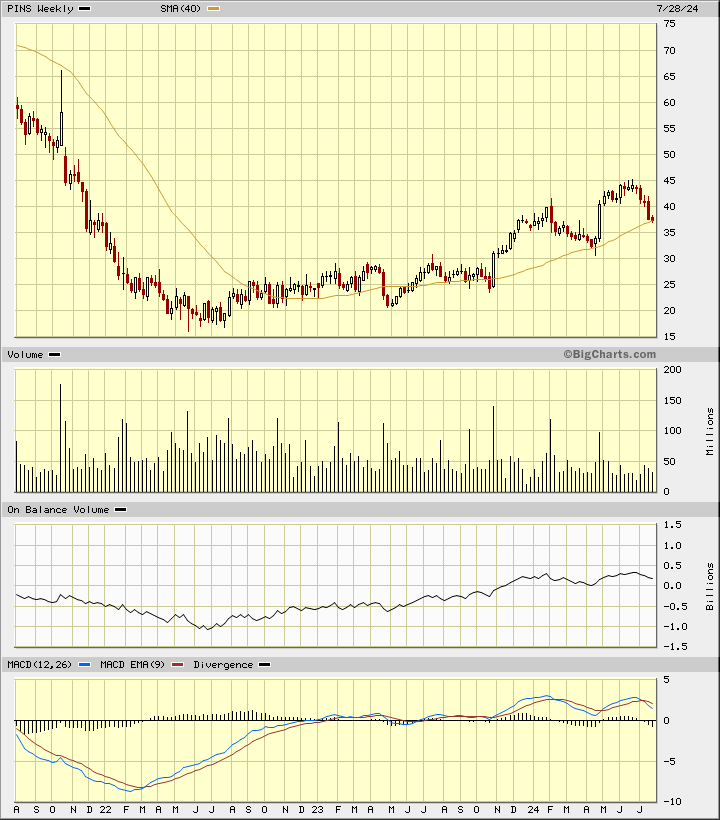
In the weekly Japanese candlestick chart of PINS, below, I have to imagine Wednesday's decline below the 40-week moving average line. The weekly trading volume has declined on the advance in the past year and that is not a vote of confidence.
The weekly OBV line has rolled over the past seven months and suggests a shift by traders from aggressive buying to aggressive selling. The MACD oscillator is correcting lower but is still above the zero line.
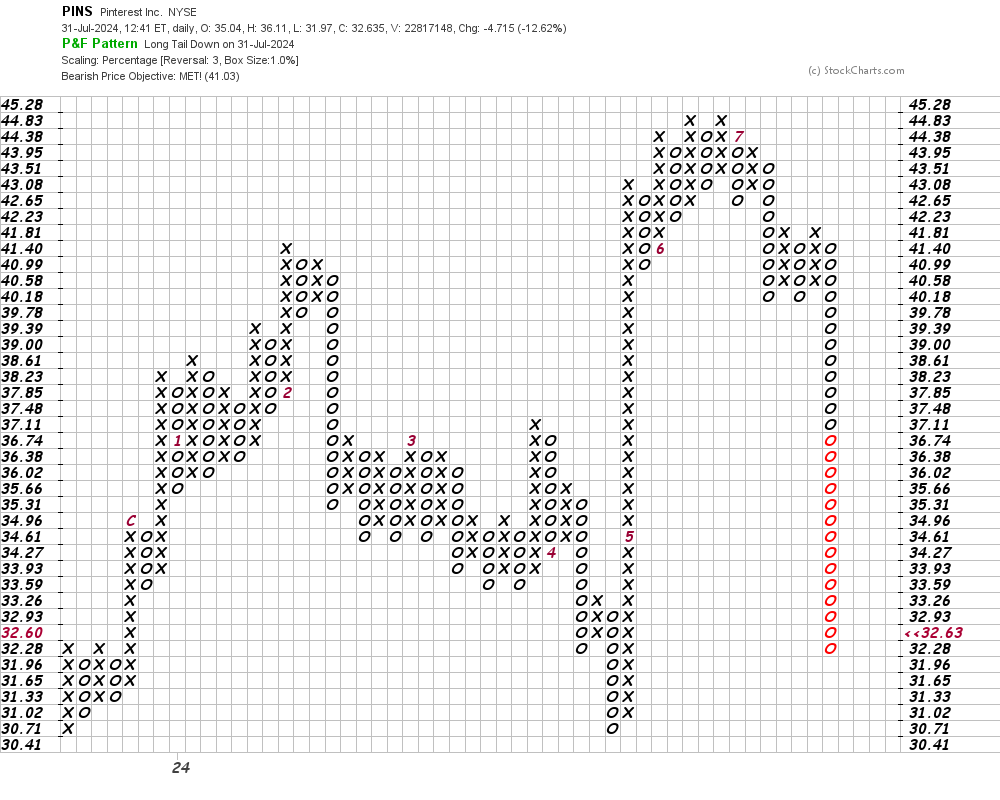
In this daily Point and Figure chart of PINS, below, I can see that prices have reached and exceeded a price target in the $41 area.
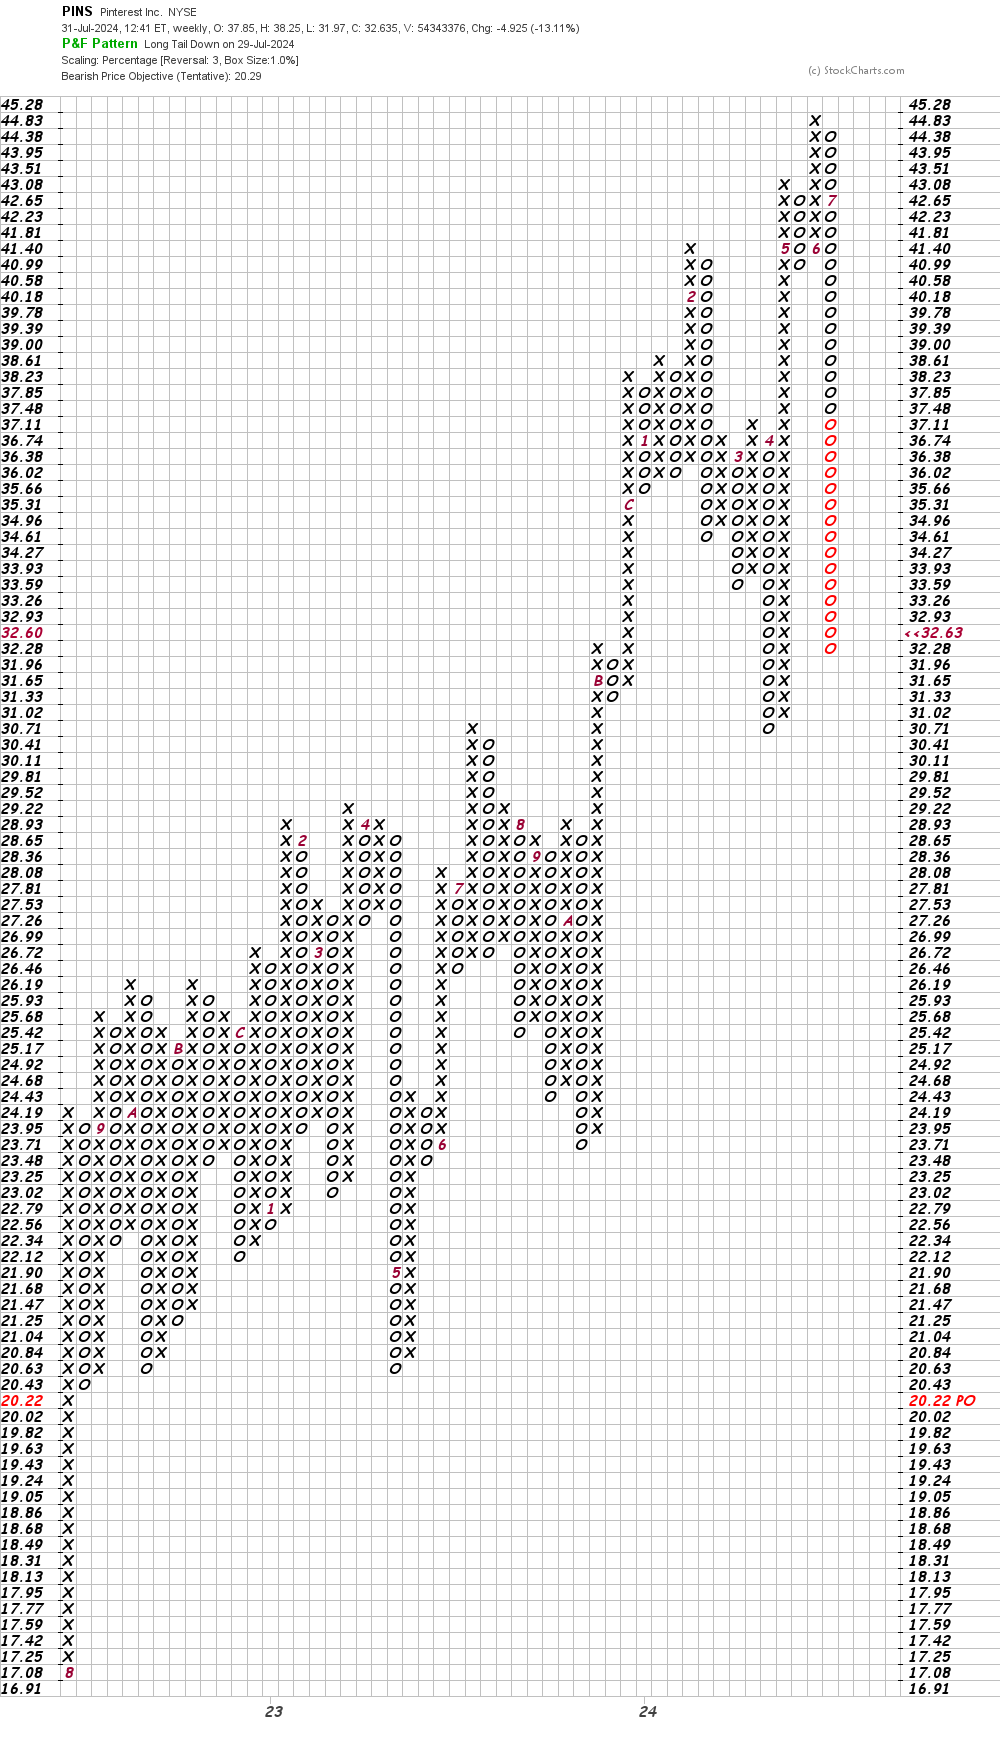
In this weekly Point and Figure chart of PINS, below, I can see that the software is now projecting a potential price target in the $20 area.
Bottom-line strategy: PINS has fallen hard in July and the odds suggest we could see further weakness in the weeks ahead. Avoid the long side of PINS.
Employees of TheStreet are prohibited from trading individual securities.