Let's Talk About Sentiment and When We Might Get to Overbought
We'll address two important questions from readers. Today's new idea is MRK and then we'll look at TSLA, IBIT, COIN, WING, and TREX.
You've reached your free article limit
You've read 0 of 1 free Pro articles.
The Market
There are two questions heating up my inbox that I would like to address.
The first is about sentiment: is everyone bullish now?
Are they all in? No, not yet. Are they headed that way? Probably. As I noted on Thursday evening, the DSI for the S&P was 82, and Nasdaq was 83, while the VIX was at 10. But as we all saw Friday’s action was not great as the S&P might have tacked on 22 points (down from nearly up 40 earlier in the day) but upside volume couldn’t even get to 50%. That means the DSI readings did not budge.
A DSI reading over 85 is the yellow flag and one over 90 is the red flag. That doesn’t mean we can’t back off from the low 80s, but a back off from here essentially resets the clock on over-the-top bullishness. Therefore a down day on Monday would ease some of the bullishness that has built up.
Even the CNN Fear and Greed indicator still sits at Greed, not even close to Extreme Greed. The put/call ratios have been easing back, but again, last week only one day saw the equity put/call ratio under .50. We had lower readings in the middle of October.
So yes folks are bullish but are they over the top? Not yet. That doesn’t mean we can’t back off, but if you want to hang your hat on too much bullishness, I’d say we’re close but not ‘all in’ yet.
Then there is the ‘when will we be overbought?’ question.
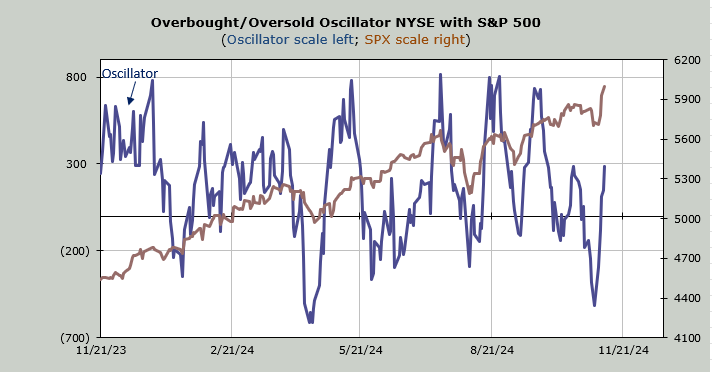
My estimation is late this week. My own Oscillator, which got oversold just over a week ago will be overbought this coming Thursday/Friday. I expect by the end of trading on Thursday, it will be at the top of the page.
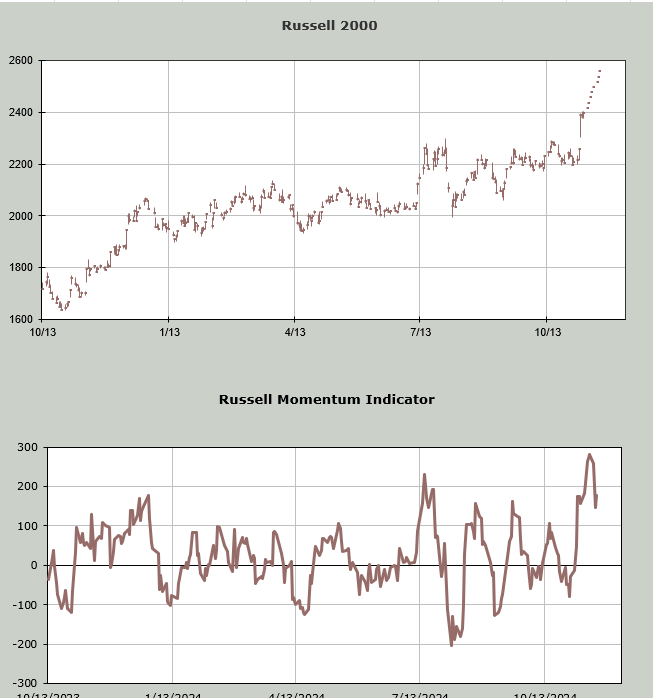
The Nasdaq Momentum Indicator will be overbought at the end of this week as well. I do the same exercise with the Russell as I do with Nasdaq so here I take the Russell and walk it up nearly 200 points in the next week or so, looking for the day the indicator peaks but price keeps rising. Overbought (and oversold) are momentum indicators so we’re looking for the point in time that we lose that momentum. This shows a downturn in the indicator while the price keeps rising late this week as well.
So imagine we pullback on Monday and then rally again into the end of the week. That pullback will likely reset sentiment. Let’s just use DSI for a minute, maybe we see a dip into the upper 70s and then another push up takes this indicator over 85 late in the week, as we’re getting overbought.
By then we’ll probably have the Investor Intelligence bulls over 60% and if the rally can stay sustained until Thursday, AAII probably flips to a sizeable bullish reading. Maybe NAAIM even pushes up near 100.
Remember, the exact day is not usually perfect, it’s the general time frame.
New Ideas
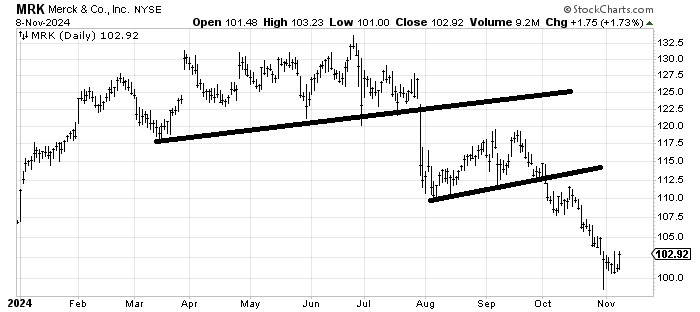
We already know I like XBI but I keep getting asked about Merck MRK because it has been so awful. There is no base to speak of however there is a measured target in the 100 area. I would expect there is a trade in it (to the upside) then it should come back down and start the process of holding and building a base.
Today’s Indicator
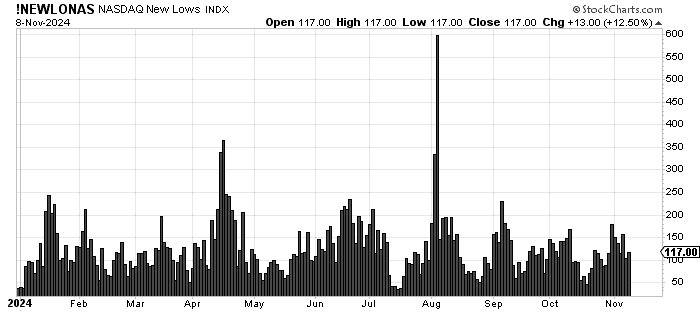
The number of new highs continues to contract. The new lows are not contracting much. For example, Nasdaq had 117 new lows on Friday. Perhaps it’s year end tax loss selling but I think that’s what we’re seeing in those poor up volume statistics too. It appears all boats are being lifted by this rally but many are being left behind.
Q&A/Reader’s Feedback
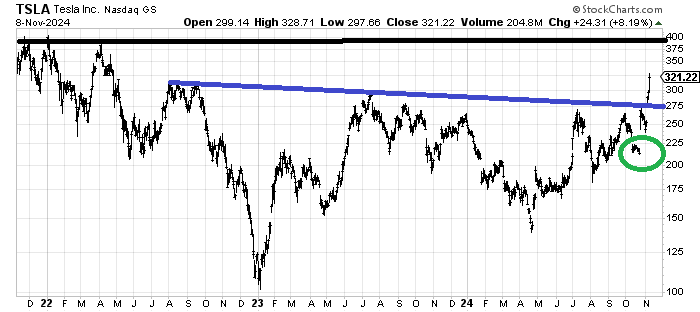
There is a lot going on on the Tesla TSLA chart. Let me begin by saying it is not a bearish chart for all who think it has gotten carried away. That green circle shows an island of sorts which is bullish.
There is a lot of resistance at that black line, let’s call it 350-400. That base (blue line) measures to around 450. I do not think it is going to go straight up without a break—heck there is resistance right here. It’s not my style to like it because I don’t chase stocks but if it falls back into the 250-275 area it is probably a buy again.
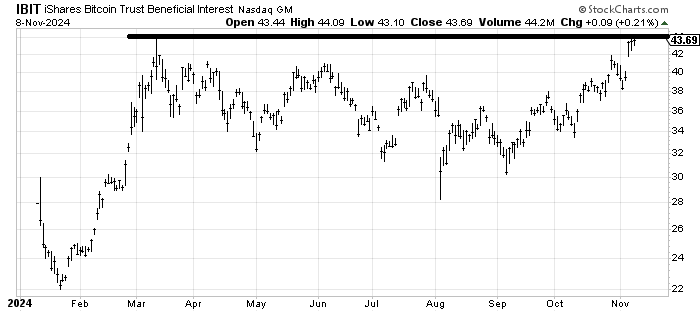
IBIT IBIT, an ETF to be long bitcoin is at an old high so it should have some resistance here. There is a next measured target around 48-ish.
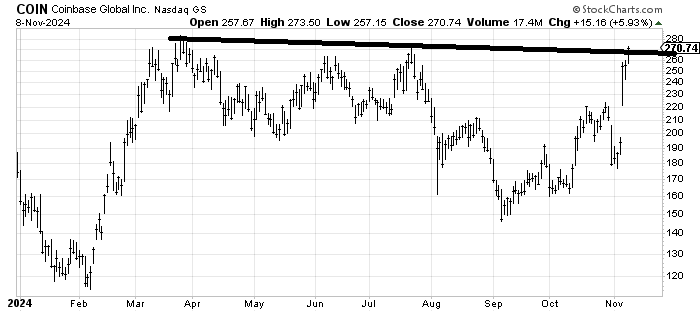
The play on bitcoin I had recommended (for the wrong reason!) was back in late September when I said if the Chinese stocks are going to run, then Coinbase COIN was a good play at 170. That has had quite a run and is at resistance and over extended but that’s the worst I can say. That head and shoulders bottom that developed between August and October measures to 270-280 so it’s not a bad place to take some profits but it hasn’t done a thing wrong.
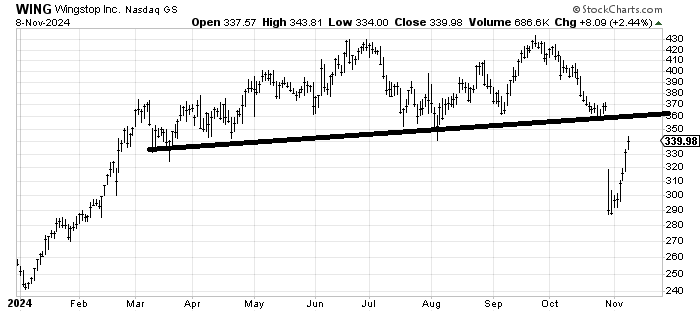
Wingstop WING broke down from the top and measured to 290 so it should start the process of repairing itself now. The first thing it should do is fill that gap around 360-370 and then it’s hard to say how far it can fall back. Much will depend on the market conditions at the time so for now I’d be a seller in that 360-370 area.
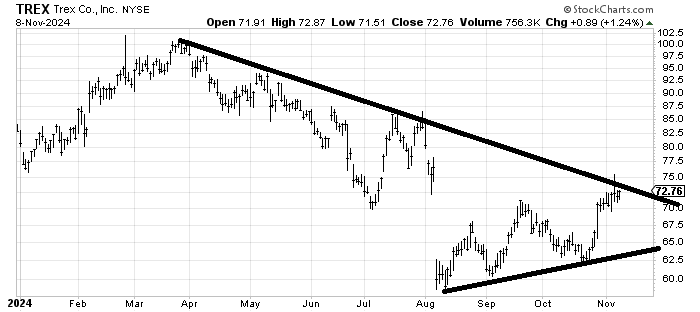
Trex TREX has filled that first gap at 75 but I am eyeing that gap at 80 because it would also cross that downtrend line. My guess is it makes a stab at getting there. If I am wrong and it can’t get over 75 then it would mean another trip back to the lower line.
Also for all of these gap down charts like WING (above) notice the way TREX has spent time building a base of sorts, that’s how it ought to play out.