Let's See If There's Chemistry for DuPont on the Charts
The chemical giant jumps after reporting a second-quarter beat and bullish guidance. Here's how to handle the stock now.
You've reached your free article limit
You've read 0 of 1 free Pro articles.
DuPont de Nemours Inc. DD is involved in the manufacture of chemicals and pharmaceuticals. Shares of DD jumped over 5% in the premarket Wednesday, after the company beat earnings estimates for the second quarter and raised its guidance for fiscal 2024.
Let's check out the charts and indicators.
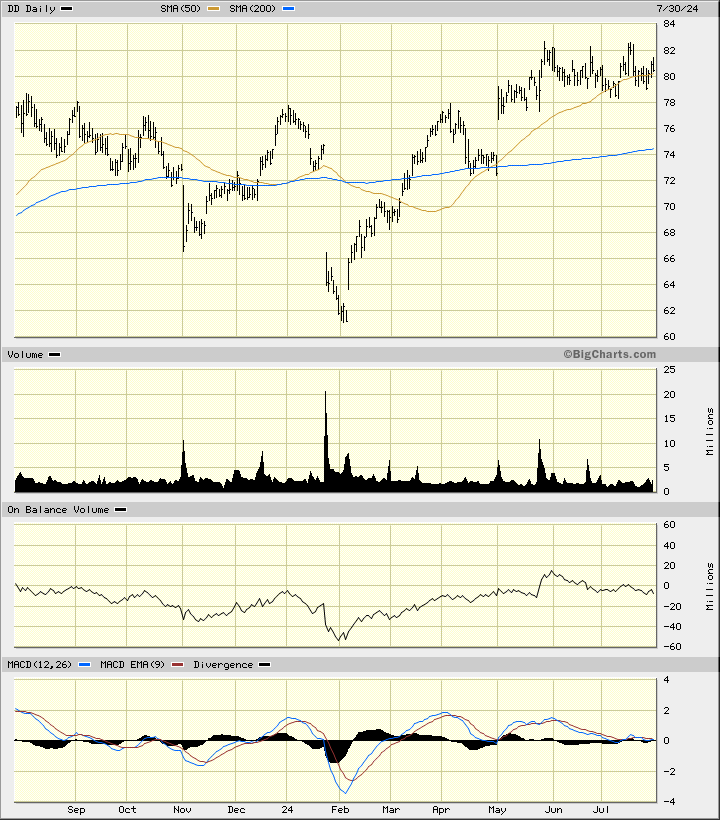
In this daily bar chart of DD, below, I can see that prices moved sideways the past two months after a rally from a "V" bottom in early February. Prices trade above the rising 50-day moving average line and above the rising 200-day moving average line so math tells us we are in an uptrend. The On-Balance-Volume (OBV) line has generally followed the moves in the share price with strength from February and a slight decline the past two months. The trend-following Moving Average Convergence Divergence (MACD) oscillator has been holding around the zero-line.
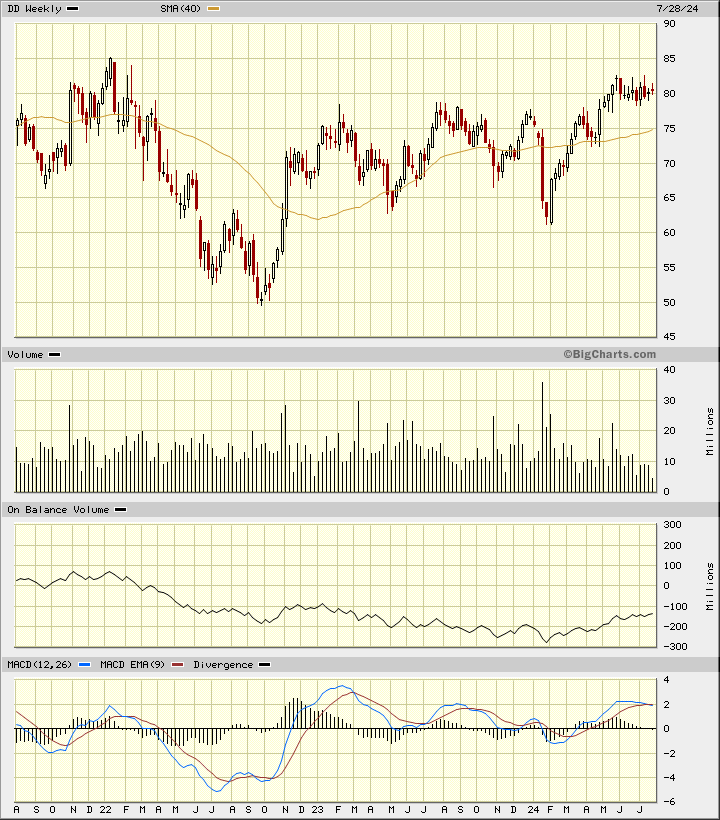
In this weekly Japanese candlestick chart of DD, below, I see a setup that can support further price gains. Prices are in a choppy uptrend from a low in 2022. Prices trade above the rising 40-week moving average line. The weekly OBV line shows us strength since February as buyers of DD have been more aggressive than sellers. The MACD oscillator is above the zero-line, but the two moving averages that make up the indicators are on top of each other.
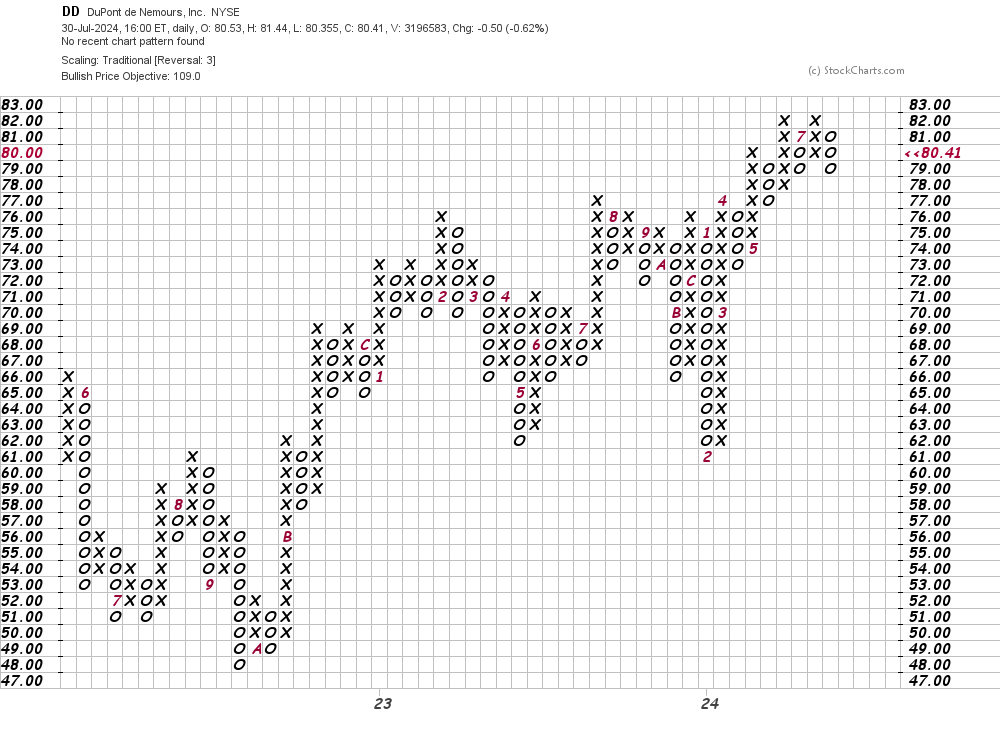
In this daily Point and Figure chart of DD, below, I can imagine prices trading up to $85 which will be a new high for the move up. This would refresh the uptrend and open the way for gains to the $109 area.
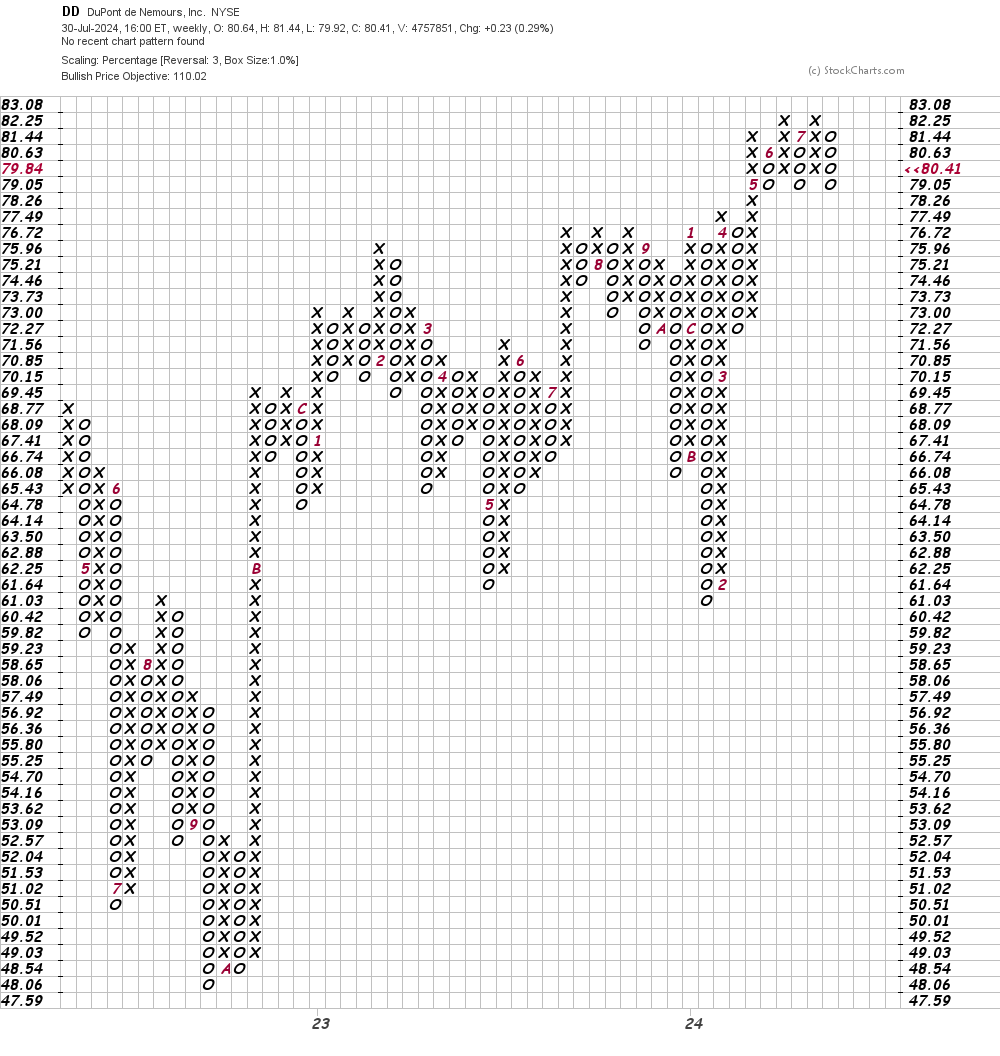
In this weekly Point and Figure chart of DD, below, I can see that the software is projecting a price target in the $110 area.
Bottom line strategy: In my May 21 update on DD I wrote that "Traders could go long DD at current levels and on shallow dips towards $79. Risk to $76. The $94 area is my first price target." Traders who are still long DD should hold.
Employees of TheStreet are prohibited from trading individual securities.