Is DuPont Set for Further Gains?
Let's drill down and see how far prices may rally in the weeks ahead.
You've reached your free article limit
You've read 0 of 1 free Pro articles.
Chemical giant DuPont de Nemours DD has recently made an upside breakout on some of the charts. Let's drill down and see how far prices may rally in the weeks ahead.
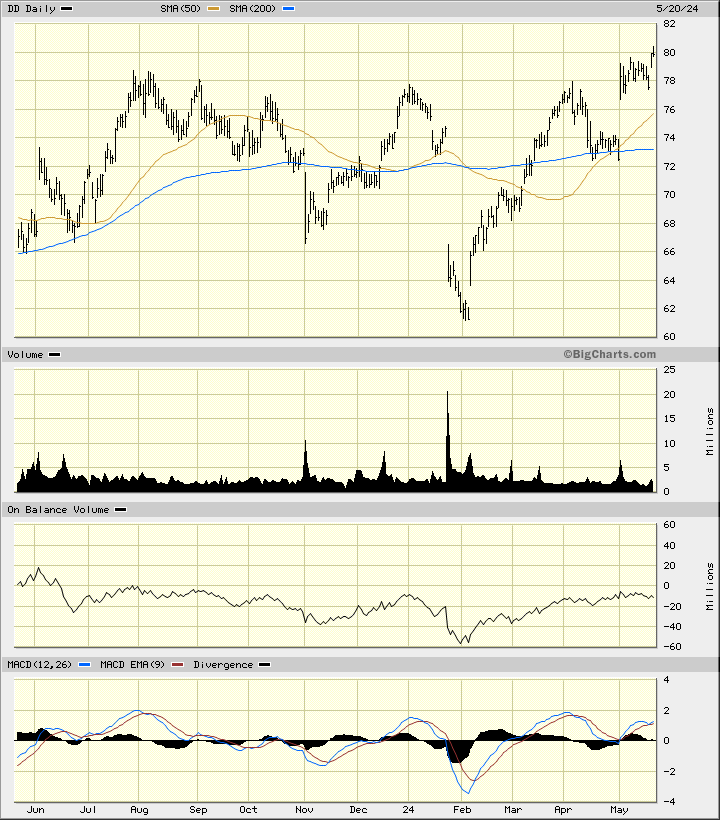
In this daily bar chart of DD, below, I can see that prices have rallied from a nadir in early February. Prices have stalled in the $78 area several times since August but prices have managed to eke out fresh gains in recent days. An upside price gap in early May has put the bulls in control. Prices trade above the rising 50-day moving average line and above the slower-to-react 200-day moving average line.
The On-Balance-Volume (OBV) line has improved from an early February low. The Moving Average Convergence Divergence (MACD) oscillator is above the zero line but at a lower high than seen in early April. This is a minor bearish divergence.
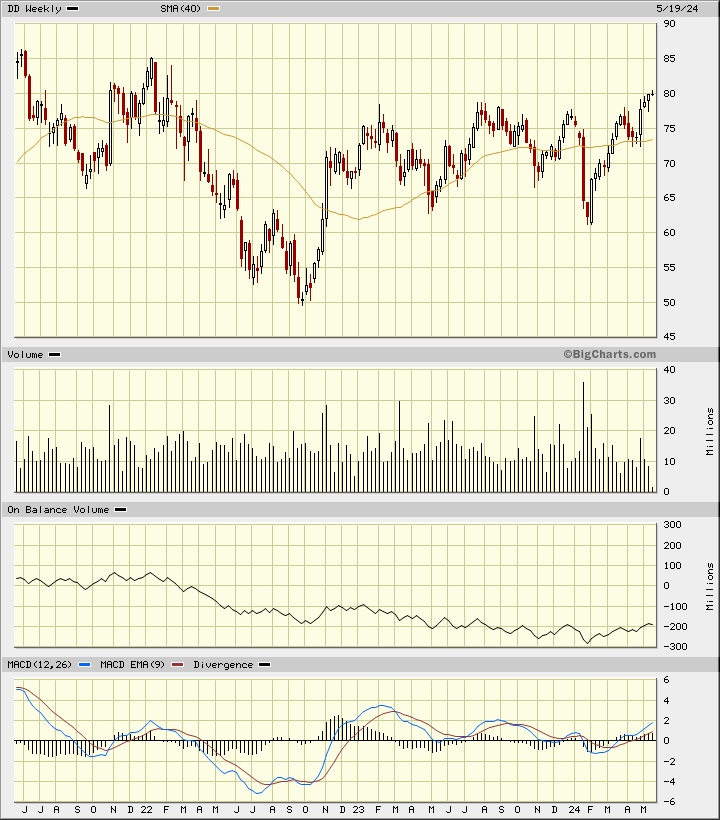
In this weekly Japanese candlestick chart of DD, below, I can see a large bullish consolidation pattern over the past three years. Prices trade above the positively sloped 40-week moving average line. Trading volume has been more active the past two years since the late 2021 low.
The weekly OBV line only or finally made a low in February before showing improvement. The MACD oscillator is in a bullish alignment above the zero line.
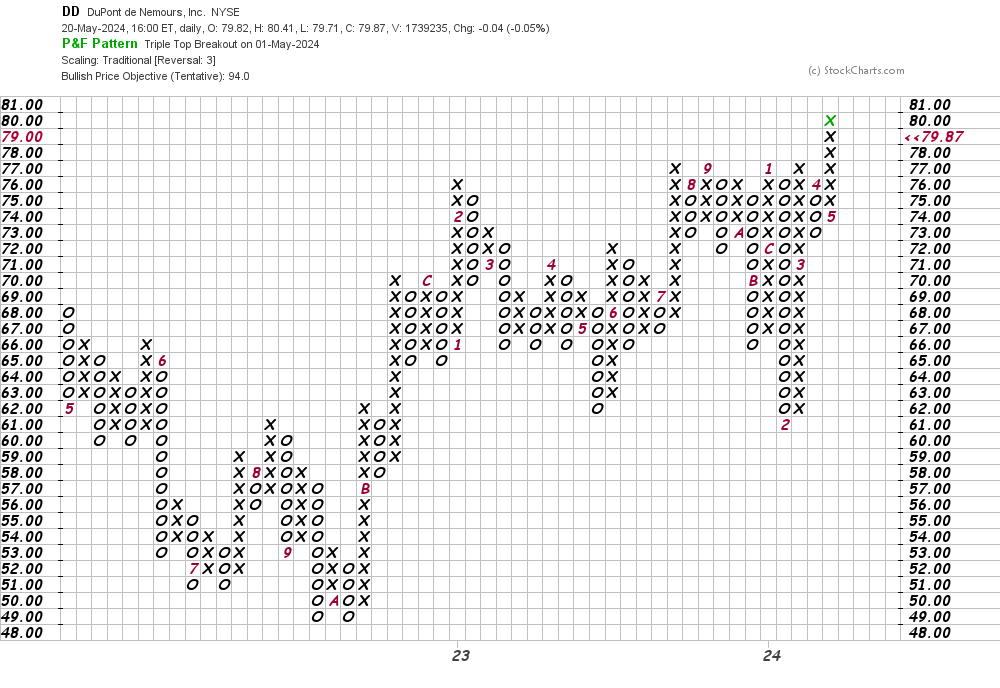
In this daily Point and Figure chart of DD, below, I can see a recent upside breakout and a price target being projected to the $94 area.
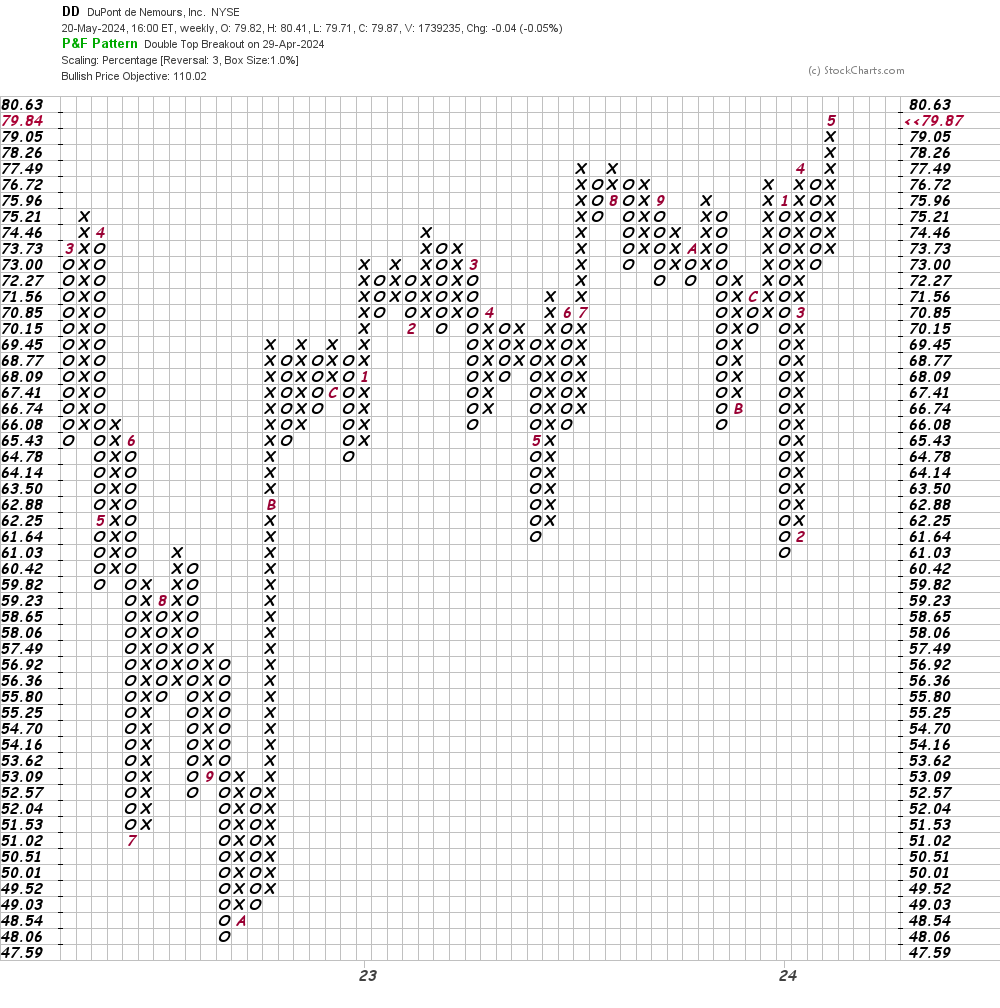
In this second Point and Figure chart of DD, below, I used weekly price data. Here the software suggests a price target in the $110 area.
Bottom line strategy: Traders could go long DD at current levels and on shallow dips towards $79. Risk to $76. The $94 area is my first price target.
Employees of TheStreet are prohibited from trading individual securities.