Let's Check the Charts of Costco Ahead of Earnings
Here's my strategy as the membership warehouse is set to report Thursday after the close.
You've reached your free article limit
You've read 0 of 1 free Pro articles.
Costco Wholesale Corp COST is expected to report earnings on Thursday after the market closes. The report will be for the fiscal quarter ending May. Costco operates a chain of membership warehouses that carry brand-name merchandise at substantially lower prices. Analysts will be watching to see how consumers are behaving and adjusting to inflation.
Let's check out the charts and indicators to see how investors and traders may be positioned.
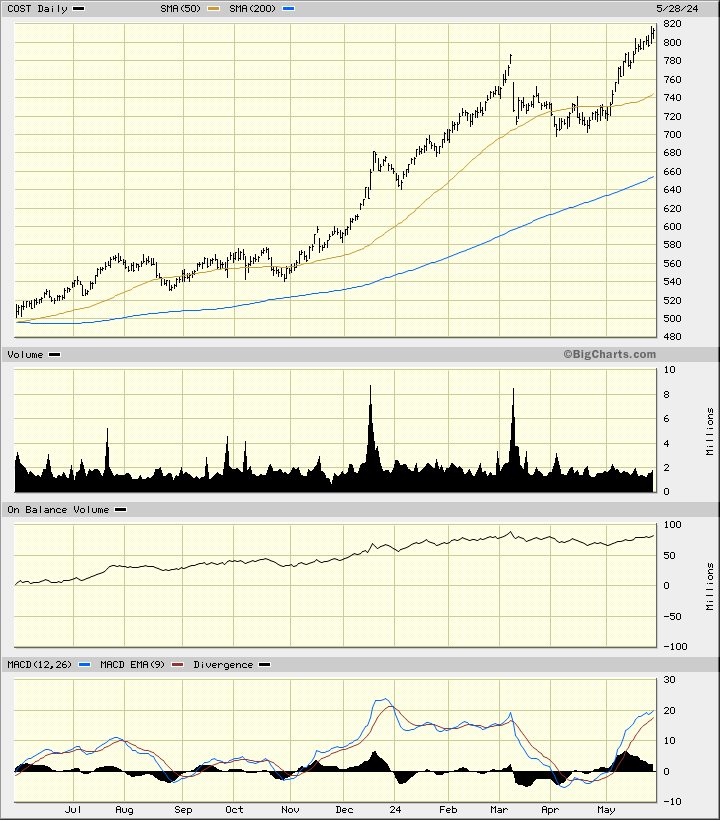
In this daily bar chart of COST, below, I can see that prices have rallied to a new high. Prices trade above the rising 50-day moving average line and above the rising 200-day moving average line. The trading volume has weakened over the past three months and does not confirm the price rise of the same period.
The On-Balance-Volume (OBV) line shows weakness since early March and a potential shift from aggressive buying to aggressive selling. The Moving Average Convergence Divergence (MACD) oscillator is making an equal high as prices make a higher high - this is a bearish divergence and could foreshadow a downward correction.
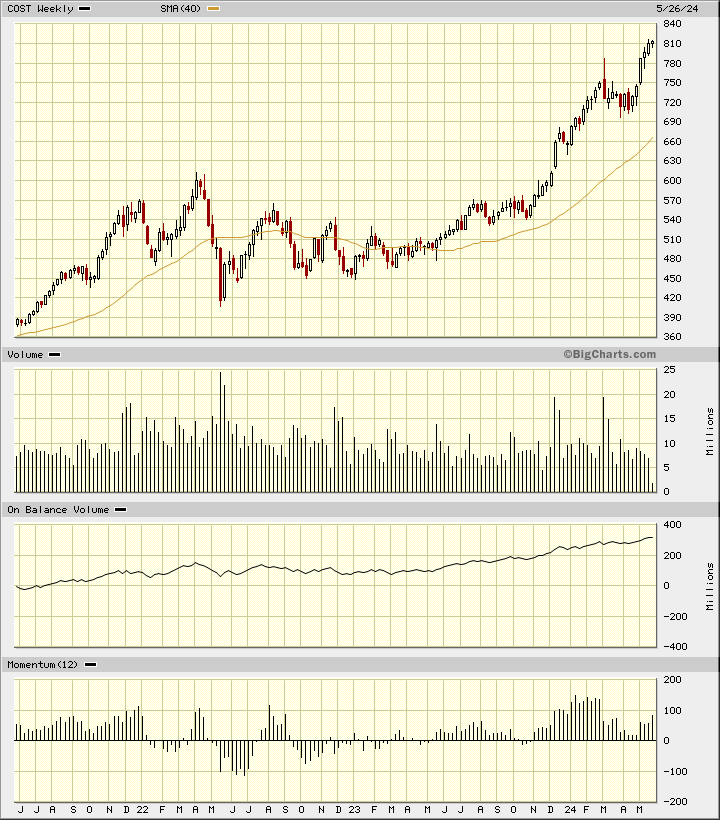
In this weekly Japanese candlestick chart of COST, below, I can see that prices have made an impressive rally over the past three years. Patient investors have been rewarded but what comes next? Prices trade above the rising 40-week moving average line so math tells us that we are in an uptrend.
The weekly OBV line has maintained an upward trend. The 12-week price momentum study is making a lower high in May versus the gains earlier in the year. This is a bearish divergence when compared to the price action which has been making new highs.
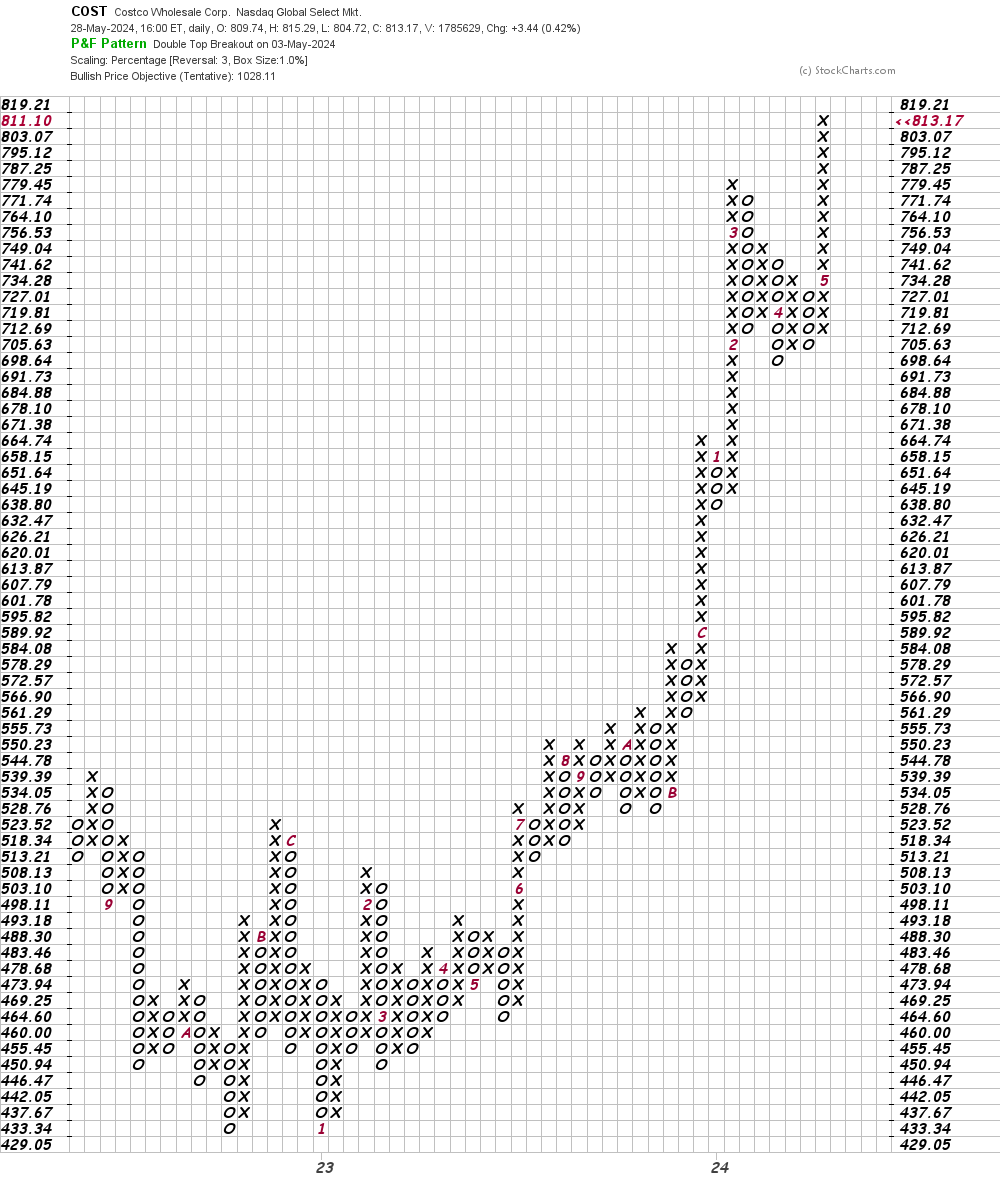
In this daily Point and Figure chart of COST, below, I can see that the software is projecting an upside price target in the $1,028 area. A big decline is needed to turn this chart bearish.
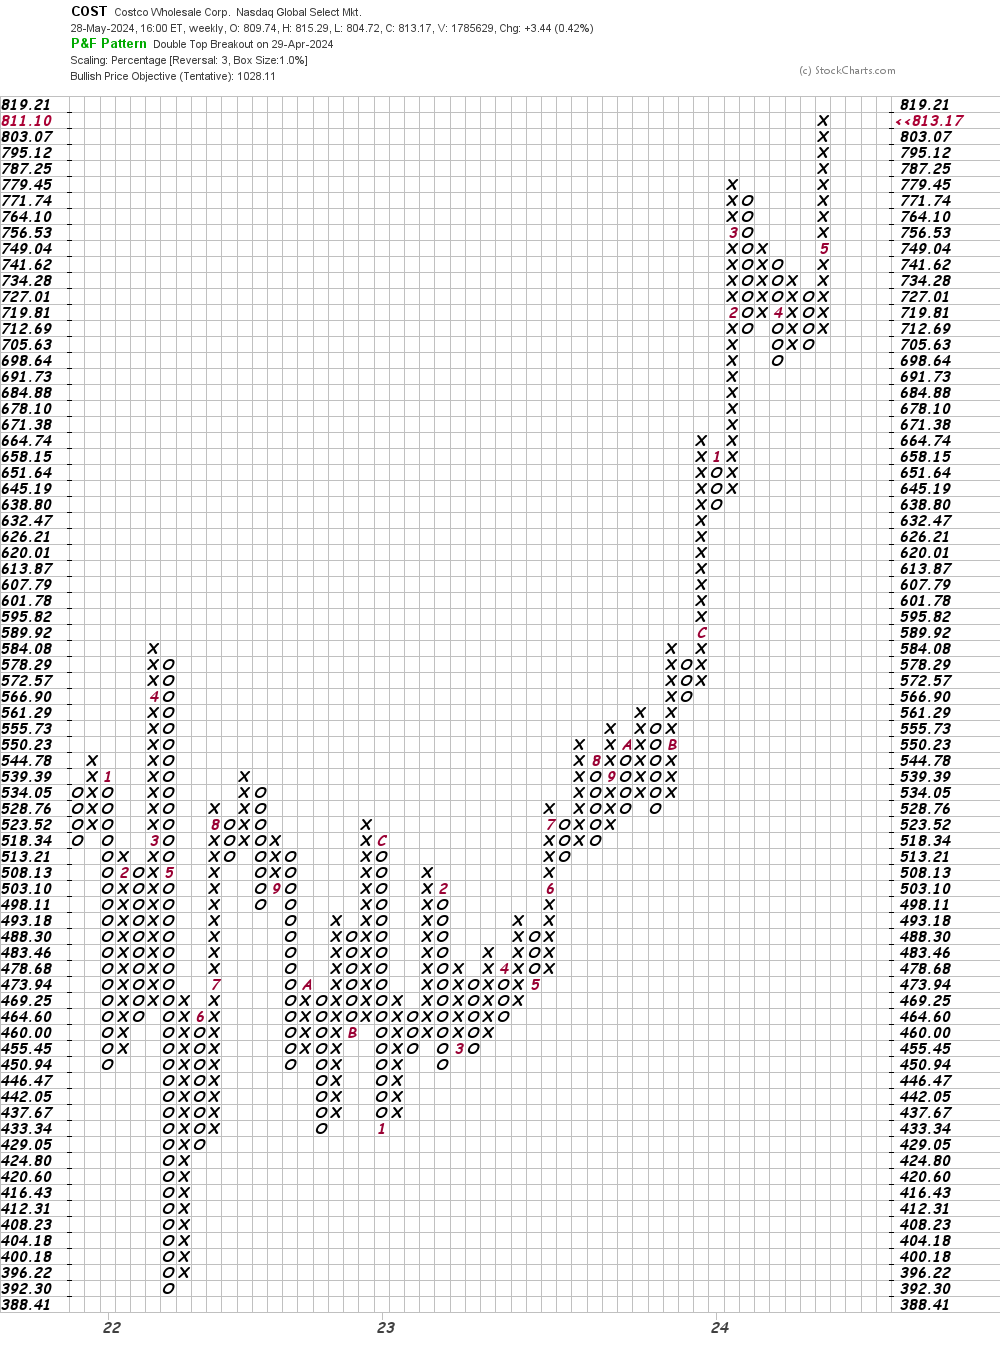
In this weekly Point and Figure chart of COST, below, I can see the same $1,028 price target as shown on the daily chart above.
Bottom line strategy: I have no special knowledge of what COST will tell shareholders. I have no unscientific observations about COST shoppers as I have not been in a Costco since moving to Delaware.
A bearish divergence from the MACD oscillator on the daily chart and a bearish divergence from the momentum study on the weekly chart suggest that traders may scale up sellers ahead of the earnings report. Reducing your long exposure to COST may be a good strategy ahead of earnings.
Employees of TheStreet are prohibited from trading individual securities.