Let's Check on the Charts of e.l.f. Beauty
Keep an eye on the price action.
You've reached your free article limit
You've read 0 of 1 free Pro articles.
e.l.f. Beauty ELF reported their quarterly numbers Wednesday night and their Non-GAAP EPS number of $0.53 beat estimates by $0.20, and revenue of $321.1M beat by $28.74M.
Initially prices declined Wednesday night but ELF was posting a healthy advance Thursday.
Let's check out the charts and indicators.
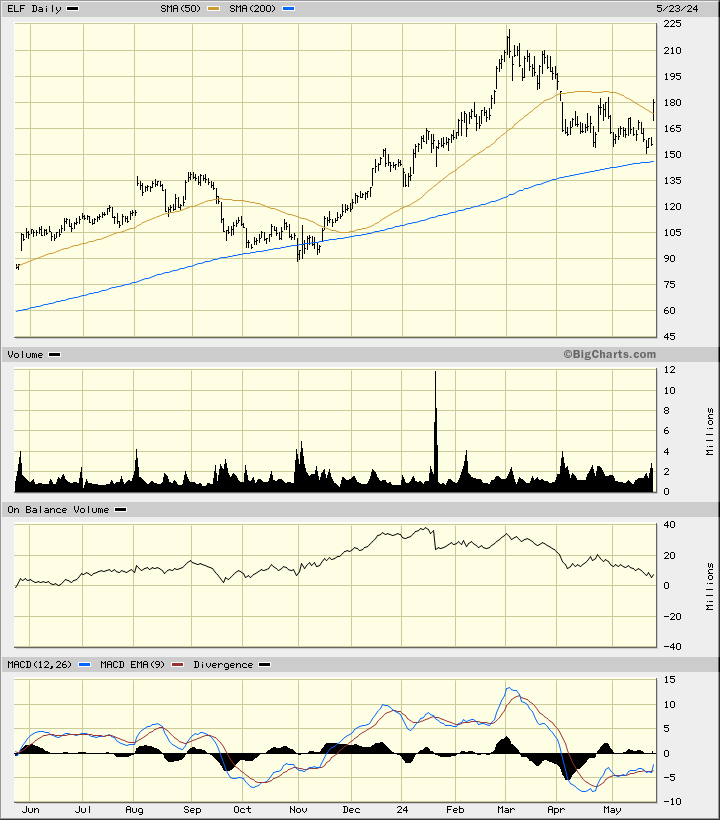
In this daily bar chart of ELF, below, I can see that prices were inching down towards the rising 200-day moving average line but gapped higher Thursday to surge above the 50-day moving average line.
The trading volume has been active/steady since January and the On-Balance-Volume (OBV) line shows a decline from the middle of January. The Moving Average Convergence Divergence (MACD) oscillator has been below the zero line since early April.
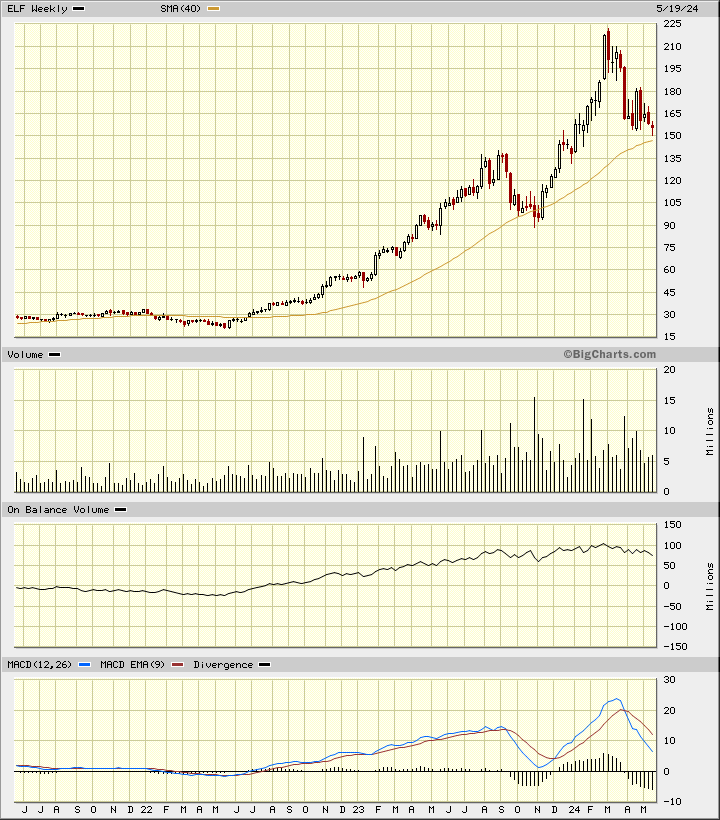
In this weekly Japanese candlestick chart of ELF, below, I can see a mixed picture. I can see a longer-term rise over the past two years. Prices trade above the rising 40-week moving average line.
The weekly OBV line shows weakness the past four months and that suggests that sellers have been more aggressive than buyers. The MACD oscillator has crossed to the downside for a take profits sell signal. This indicator is still above the zero line.
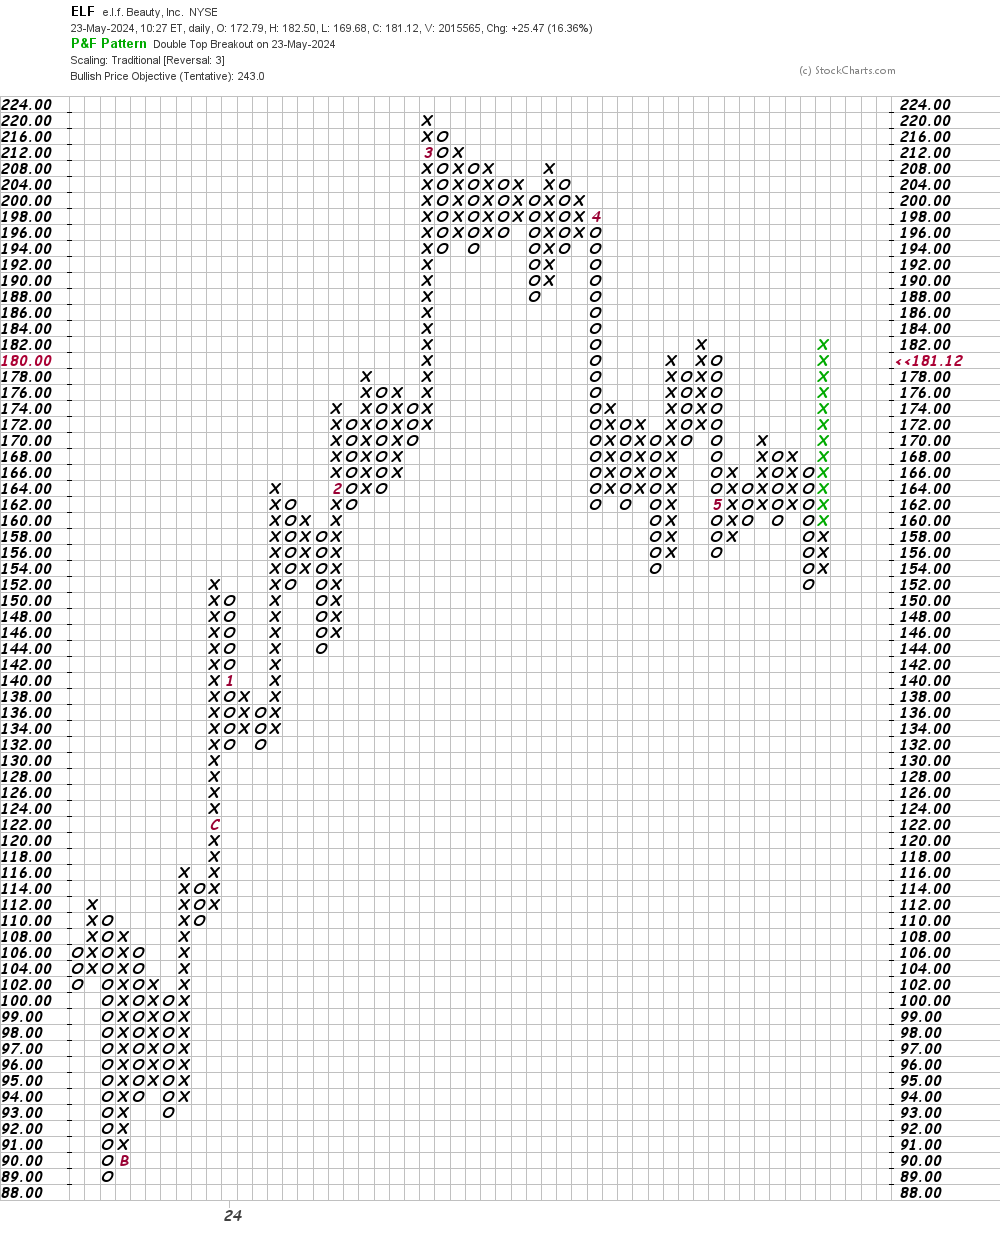
In this daily Point and Figure chart of ELF, below, I can see an upside price target in the $243 area.
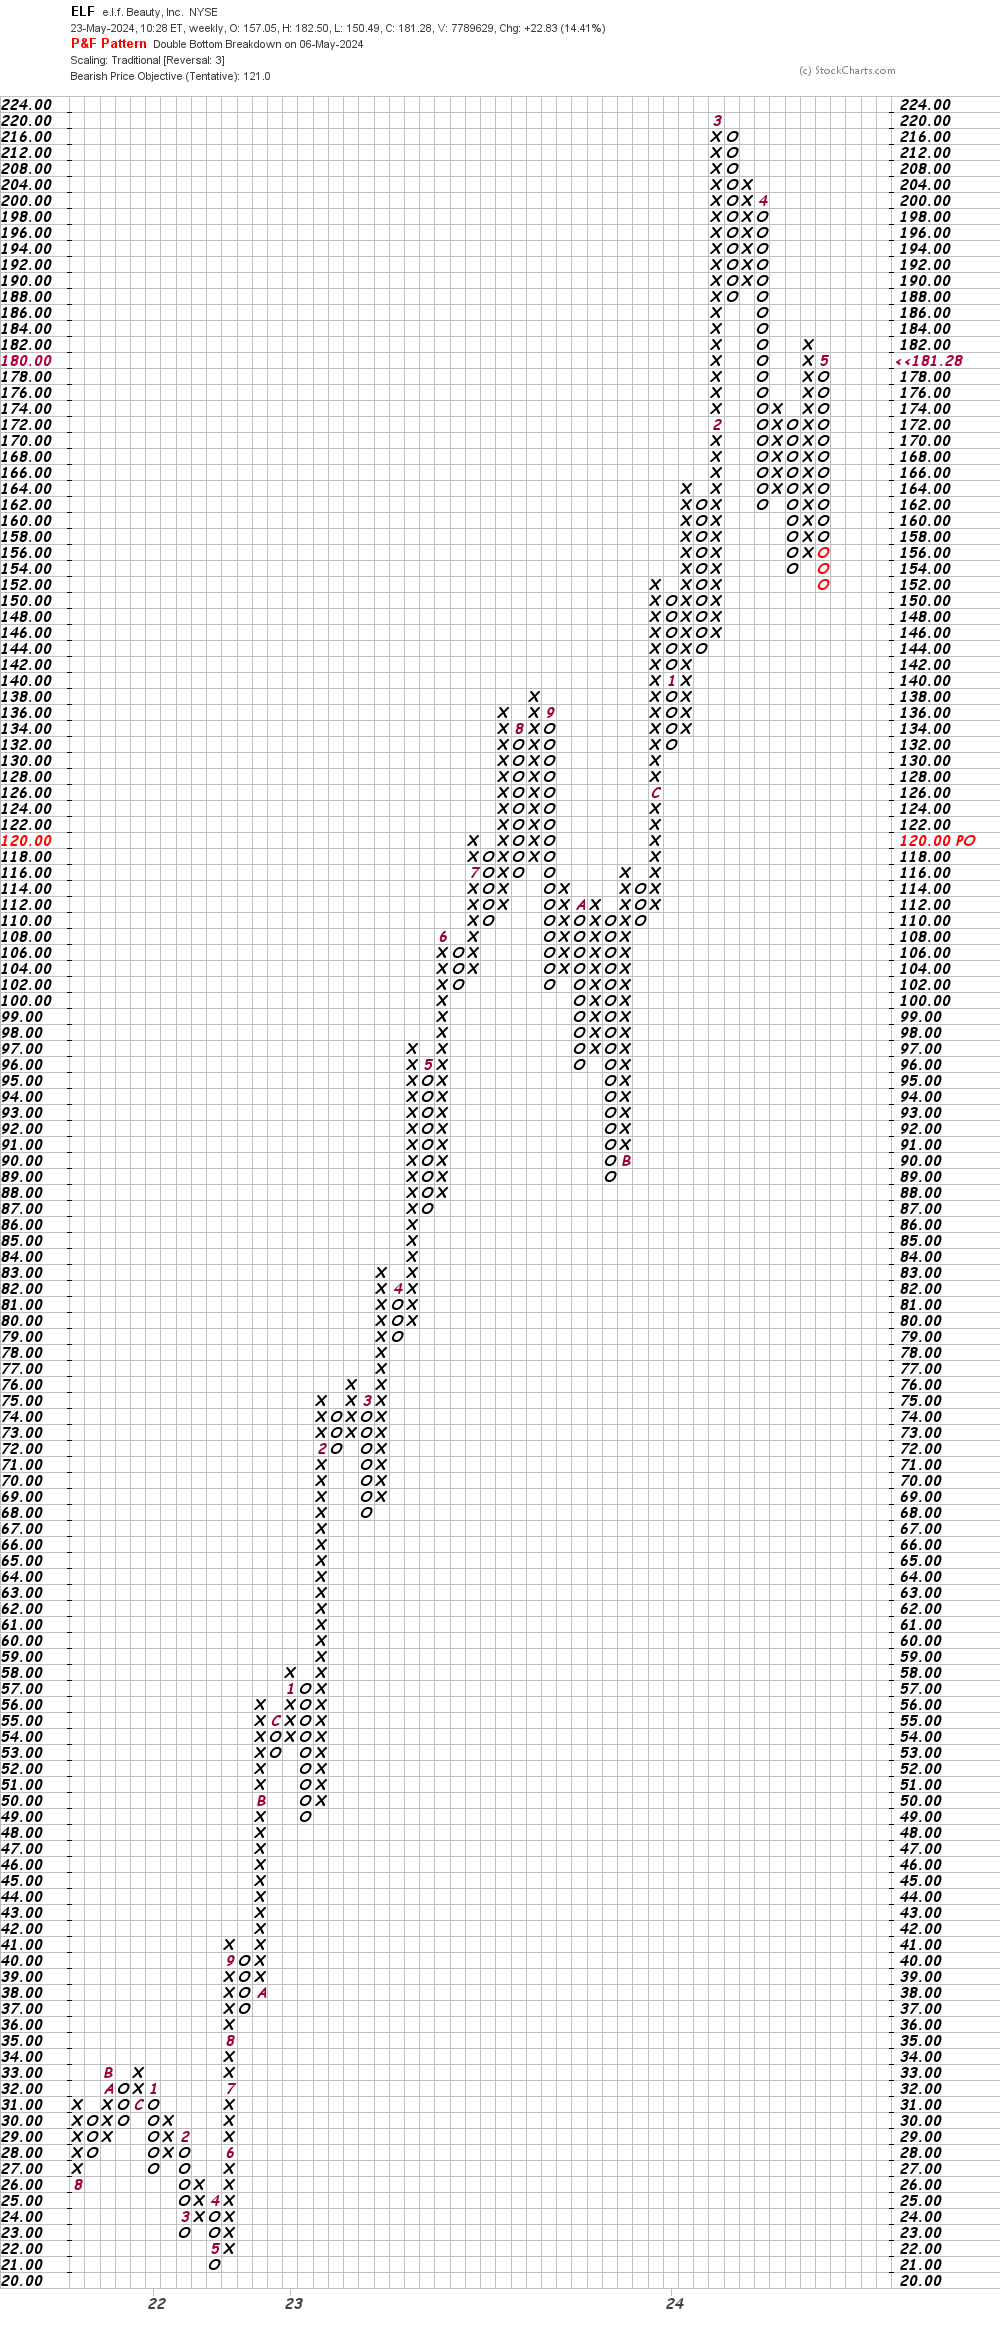
In this weekly Point and Figure chart of ELF, below, I can see a potential downside price target in the $121 area.
Bottom line strategy: Shares of ELF corrected lower for three months and then gapped higher Thursday. I am not in a rush to recommend the long side of ELF just yet. I want to see more price action before making up my mind.
Employees of TheStreet are prohibited from trading individual securities.