Johnson & Johnson Could See Further Declines
Revenue growth has slowed across all categories.
You've reached your free article limit
You've read 0 of 1 free Pro articles.
Johnson & Johnson JNJ reported Tuesday morning that their Q1 year over year revenue growth numbers slowed across all categories. The pharma giant also set guidance below consensus as MedTech underperforms.
Let's review the charts and indicators.
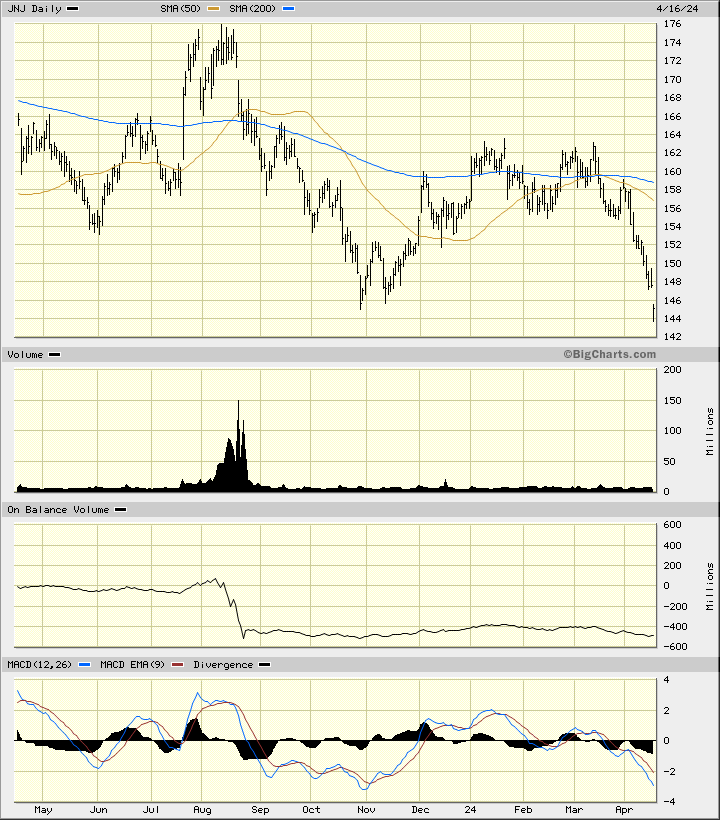
In this daily bar chart of JNJ, below, I can see that prices have gapped lower Tuesday and traded at a new low for the move down. JNJ trades below the declining 50-day moving average line and below the declining 200-day line.
The On-Balance-Volume (OBV) line shows weakness from the middle of January. The trend-following Moving Average Convergence Divergence (MACD) oscillator has made a new low for its move to the downside below the zero line.
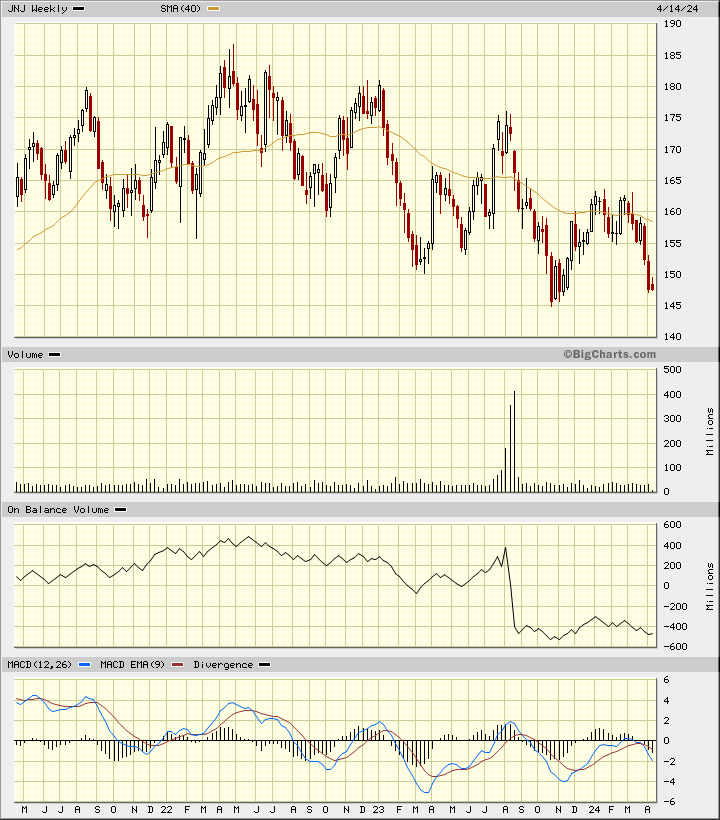
In this weekly Japanese candlestick chart of JNJ, below, I can see a longer-term decline still in progress. Prices trade below the declining 40-week moving average line.
The weekly OBV line remains weak and suggests that traders are more aggressive sellers than buyers. The MACD oscillator has turned lower after failing at the underside of the zero line.
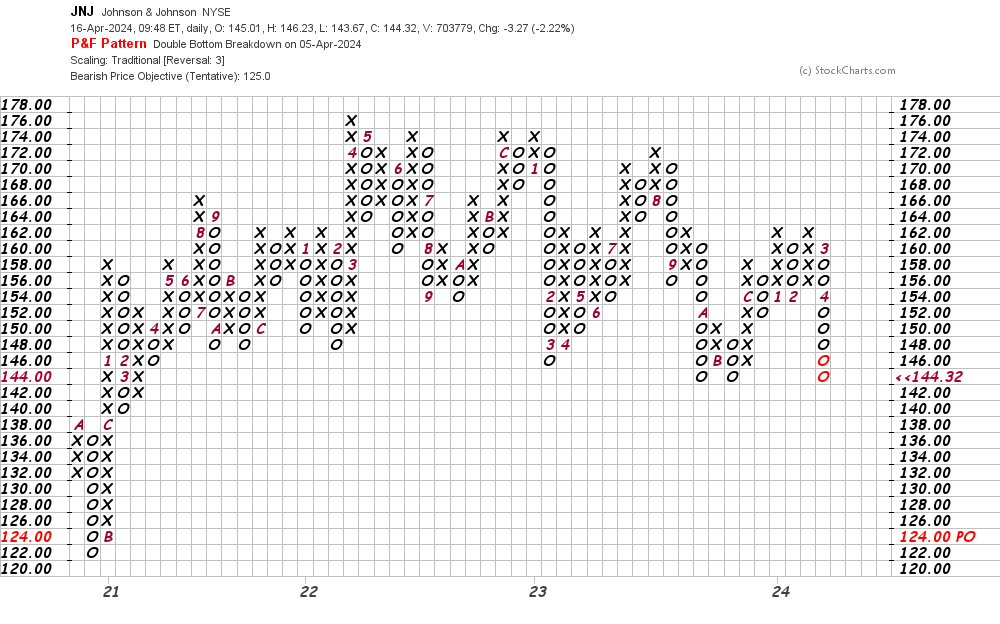
In this daily Point and Figure chart of JNJ, below, I can see a potential downside price target in the $125 area.
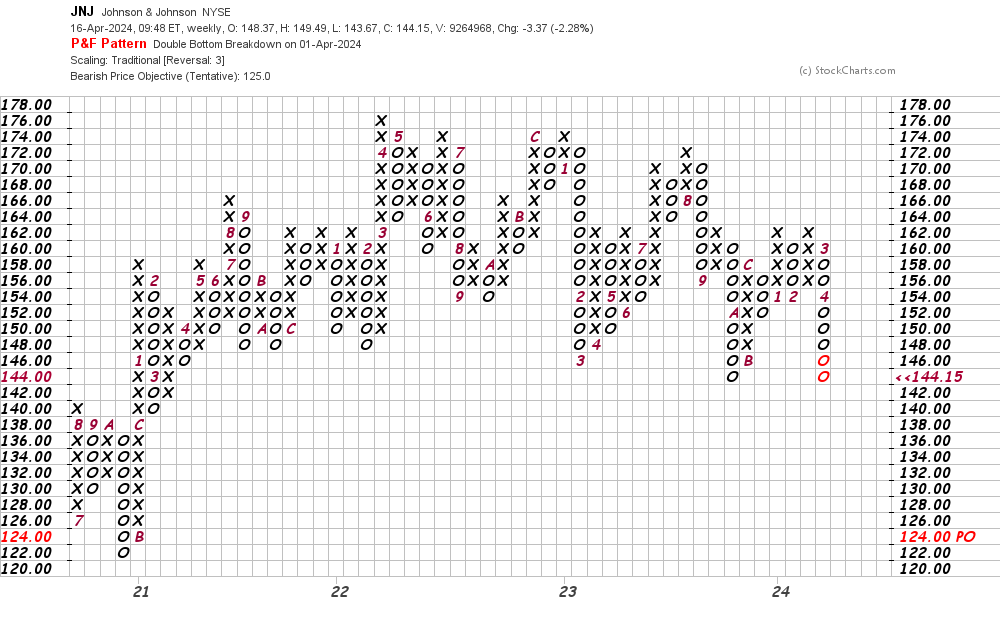
In this weekly Point and Figure chart of JNJ, below, I can see a target in the $125 area - the same as the daily chart above.
Bottom line strategy: The charts and indicators of JNJ suggest we could see further declines in the weeks ahead. Avoid the long side of JNJ.
Employees of TheStreet are prohibited from trading individual securities.