Is the iShares 20+ Year Treasury Bond ETF a Buy Here?
The narrative about interest rates in the U.S. has changed significantly. Here's what traders can do.
You've reached your free article limit
You've read 0 of 1 free Pro articles.
It is the shot heard around the financial markets — interest rates are coming down.
Let's check out the charts of the iShares 20+ Year Treasury Bond ETF TLT to see if a trade makes sense now.
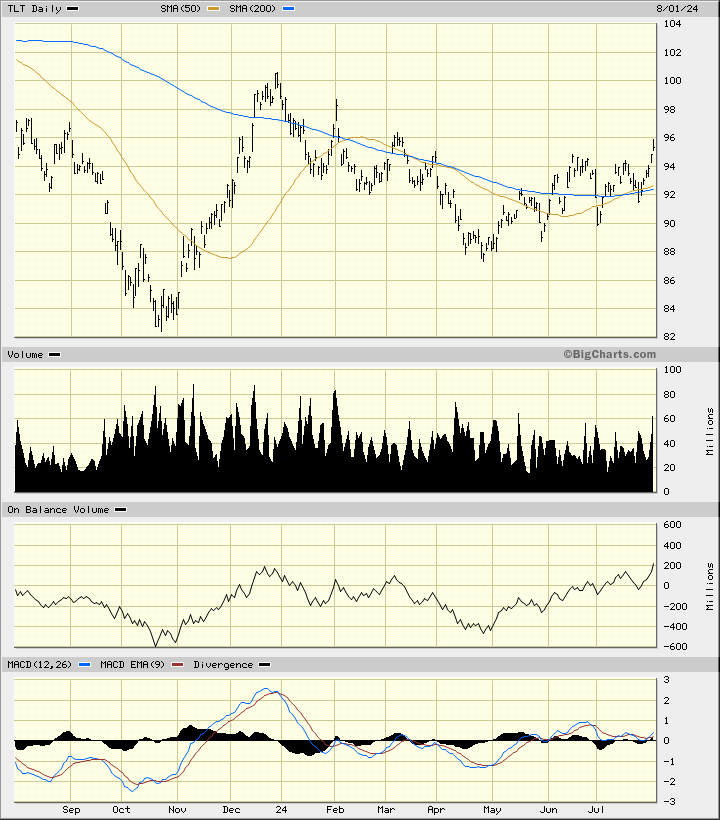
In the daily bar chart of the TLT, below, I can see that the shares have worked higher the past three months. TLT now trades above the rising 50-day moving average line and above the rising 200-day moving average line. The trading volume has been steady and active since April.
The On-Balance-Volume (OBV) line has made a strong move to the upside since the end of April and confirms the price gains we have seen. The trend-following Moving Average Convergence Divergence (MACD) oscillator has been hugging the zero line in July but is now turning higher to an outright buy signal.
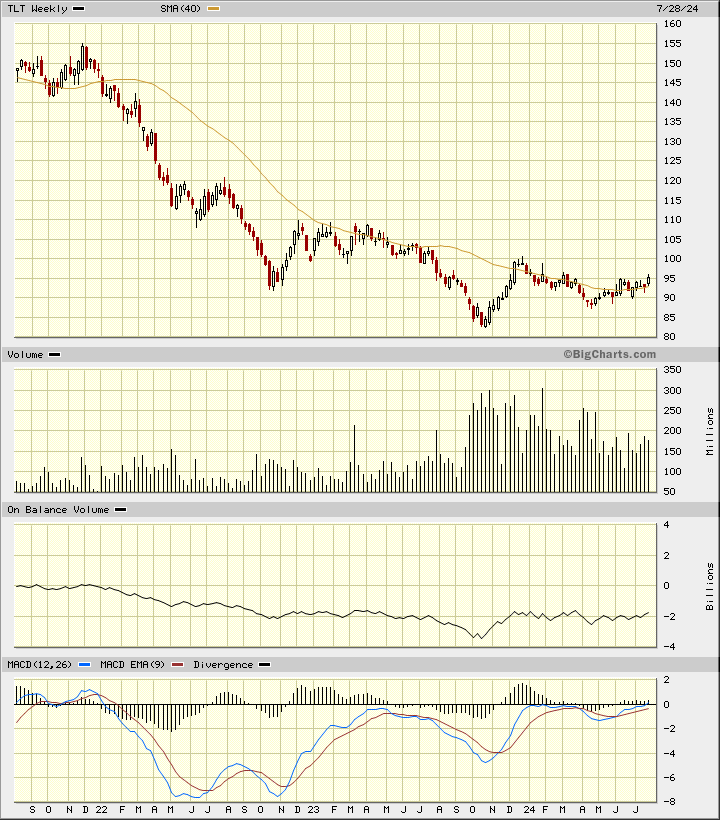
In the weekly Japanese candlestick chart of TLT, below, I can see a long decline over the past three years as interest rates rose. A low was finally reached in October of 2023 and prices turned sideways. TLT is now trading above the bottoming 40-week moving average line. The trading volume was very active at the price low last year and subsequently declined.
Did long-term investors jump on the long side of the TLT at the lows? Have investors shifted their interest from fixed income to the soaring tech names? Hard to answer those questions.
The weekly OBV line has been steady the past seven months and I would want to see this indicator turn to the upside now. The MACD oscillator has been improving since November and is now close to crossing above the zero line.
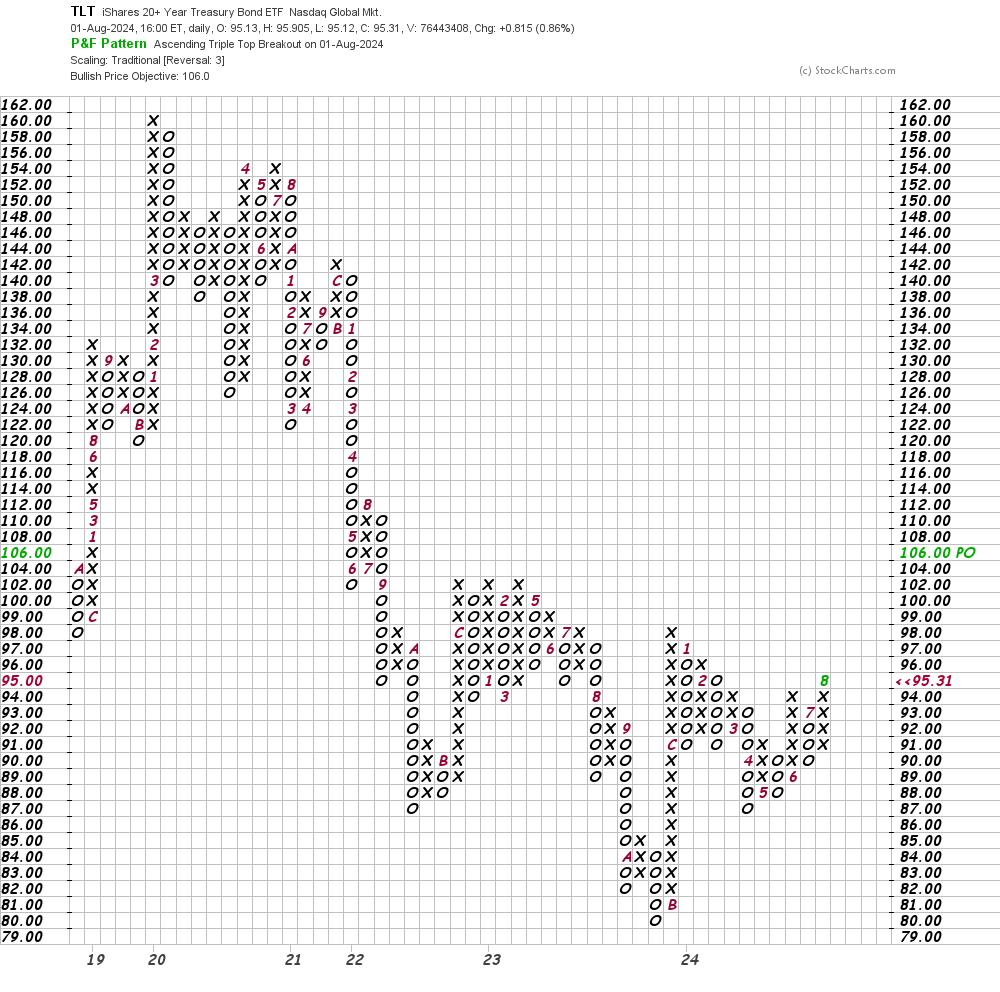
In this daily Point and Figure chart of the TLT, below, I can see an upside price target in the $106 area. A trade at $106 will be an important upside breakout on this chart and could open the way to further gains. We'll see.
Bottom-line strategy: The narrative about interest rates in the U.S. has changed significantly in recent weeks. More investors anticipate that the Fed will cut interest rates while a significant number of people see the economy weakening, which could also mean that rates decline in the months ahead.
Traders could consider going long the TLT at current levels risking to $91. A rally into the $105-$100 area is what I would look for at this point in time. I am looking to exit this trade in late December.
If you have money sitting in a money market fund you might call your bank for rates about something like a 7-month CD.
Employees of TheStreet are prohibited from trading individual securities.