Is NXP's Plunge Another Buy Opportunity?
The latest numbers from the semiconductor maker disappointed investors.
You've reached your free article limit
You've read 0 of 1 free Pro articles.
NXP Semiconductors N.V. NXPI released its second-quarter 2024 results Monday night and they matched estimates, but the company's guidance fell short and the share price was down sharply Tuesday.
Let's check out the charts and indicators.
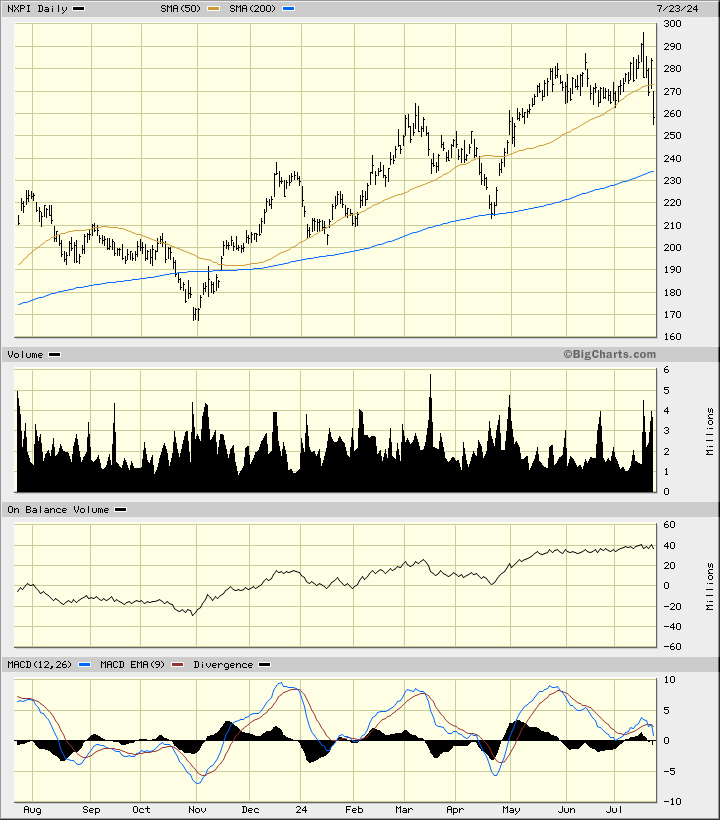
In the daily bar chart of NXPI, below, I can see that the shares have recently pulled back and are now trading below the 50-day moving average line. The 50-day line is just cresting and the 200-day line still has a positive slope.
The On-Balance-Volume (OBV) line has been rising since late October and tells me that buyers of NXPI have been more aggressive than sellers. The OBV line is still pointed up. The Moving Average Convergence Divergence (MACD) oscillator is still above the zero line but that condition may not last much longer.
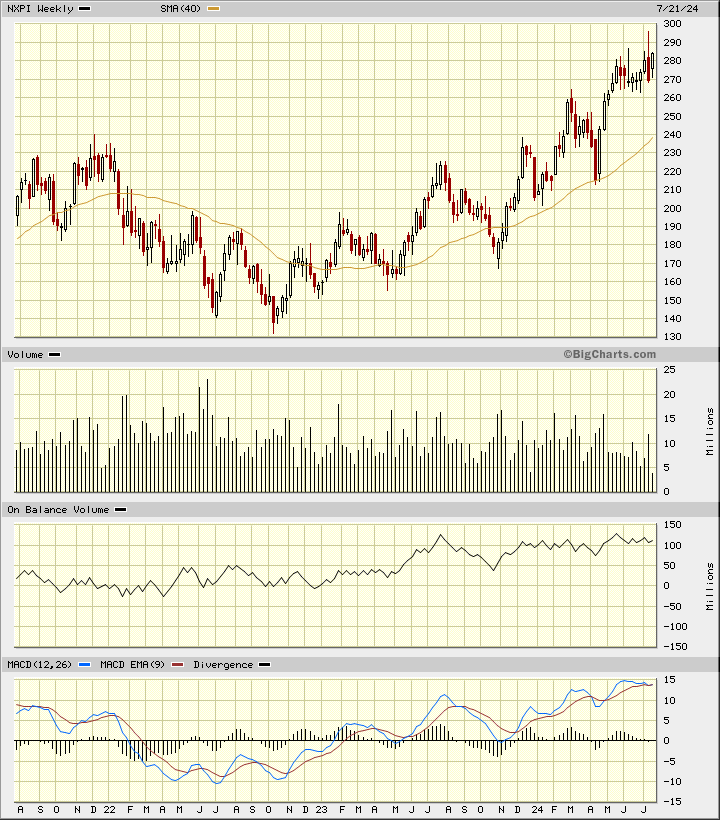
In the weekly Japanese candlestick chart of NXPI, below, I see a mixed to bearish setup. A recent candlestick bar shows me a large upper shadow telling me that traders rejected the highs.
The 40-week moving average line is still bullish and so is the OBV line. The MACD oscillator could cross to the downside soon for a take profit sell signal.
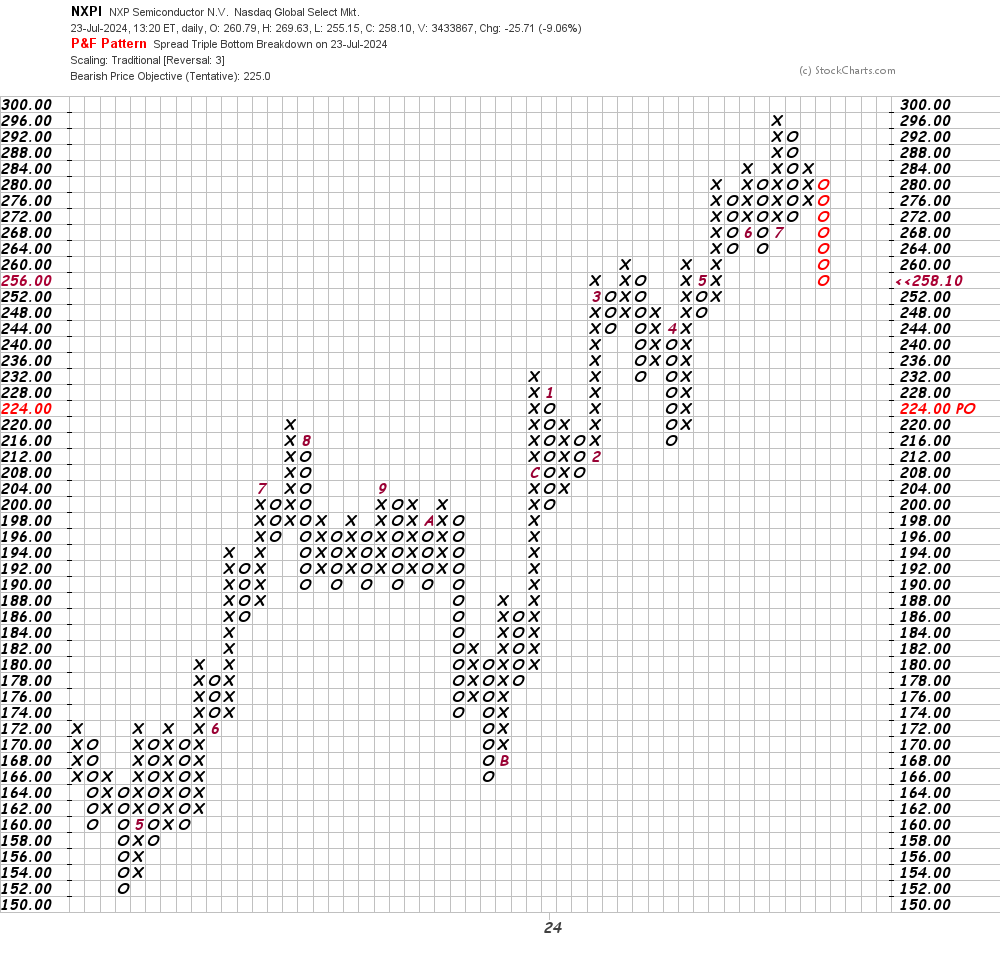
In this daily Point and Figure chart of NXPI, below, I can see a potential downside price target in the $225 area.
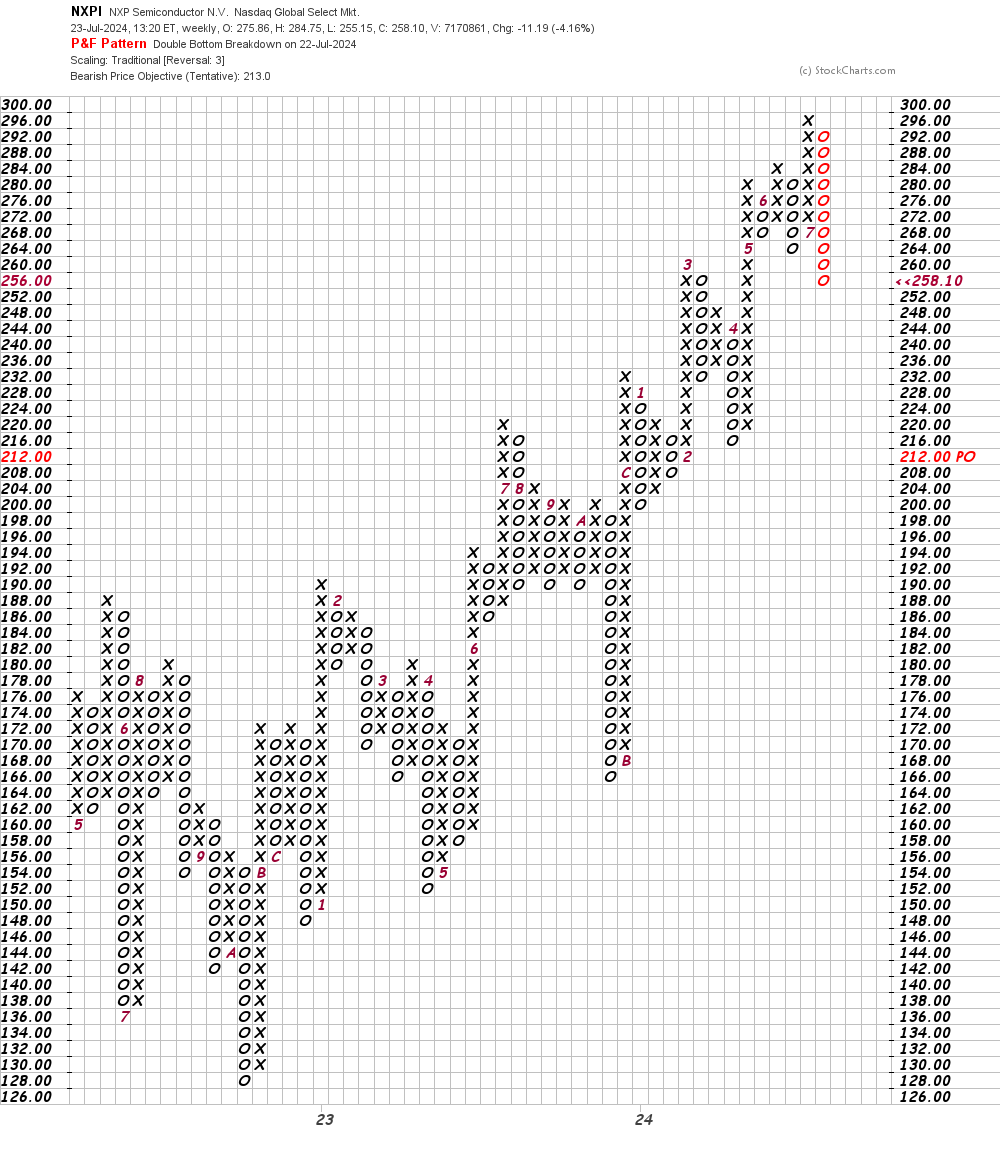
In this weekly Point and Figure chart of NXPI, below, I can see a downside price target in the $213 area.
Bottom-line strategy: Two previous pullbacks in NXPI in the past year were buying opportunities. Traders looking to go long NXPI should keep their powder dry for now as the pullback may not be over just yet.
Employees of TheStreet are prohibited from trading individual securities.