Is It Time to Stock Up on Mondelez or Refrain From Snacking?
What's in your pantry? Let's check the charts and indicators of this global snack foods giant.
You've reached your free article limit
You've read 0 of 1 free Pro articles.
Mondelez International MDLZ is a global snacking giant with brands such as Oreo, Chips Ahoy!, Ritz, Wheat Thins, and more. I know that a number of these brands are in my food pantry right now. I don't have a lot of will power when I do the weekly shopping.
Let's check the charts and indicators of MDLZ to see if my purchases have contributed to the bottom line.
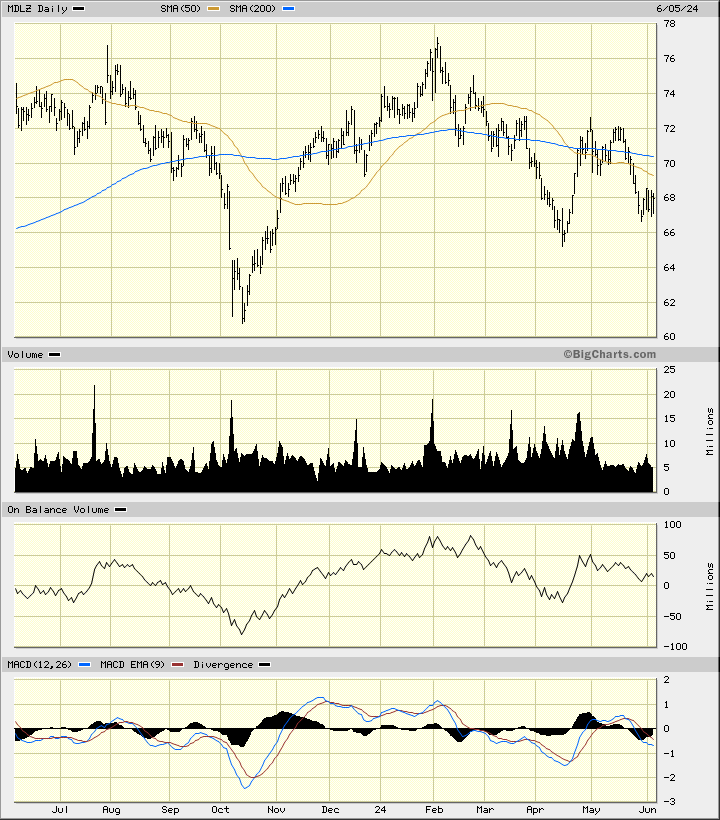
In the daily bar chart of MDLZ, below, I can see that the shares have been on the weak side the past four months. WEN trades below the declining 50-day moving average line and below the bearish 200-day moving average line.
The On-Balance-Volume (OBV) line has been weak since the middle of February. The Moving Average Convergence Divergence (MACD) oscillator is below the zero line telling us that MDLZ lacks trend strength.
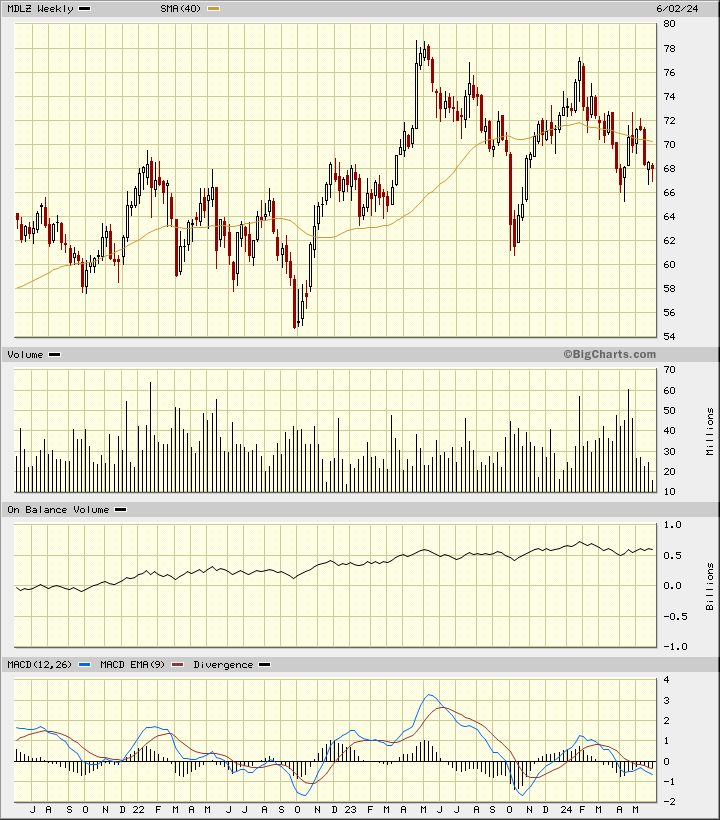
In the weekly Japanese candlestick chart of MDLZ, below, I can see that prices made a high a year ago. MDLZ has made lower highs for the past year. The shares trade below the declining 40-week moving average line.
The OBV line turned lower four months ago and could be signaling a major change in investor's attitudes. The MACD oscillator turned lower a year ago and it is now below the zero line.
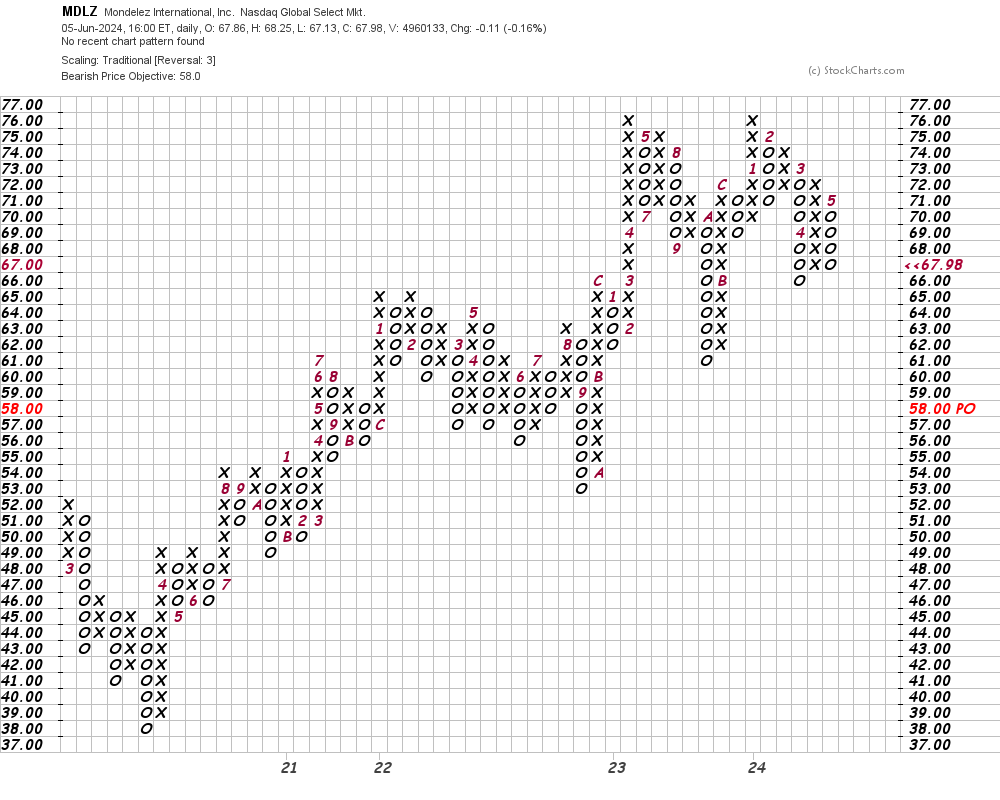
In this daily Point and Figure chart of MDLZ, below, I can see a downside price target in the $58 area.
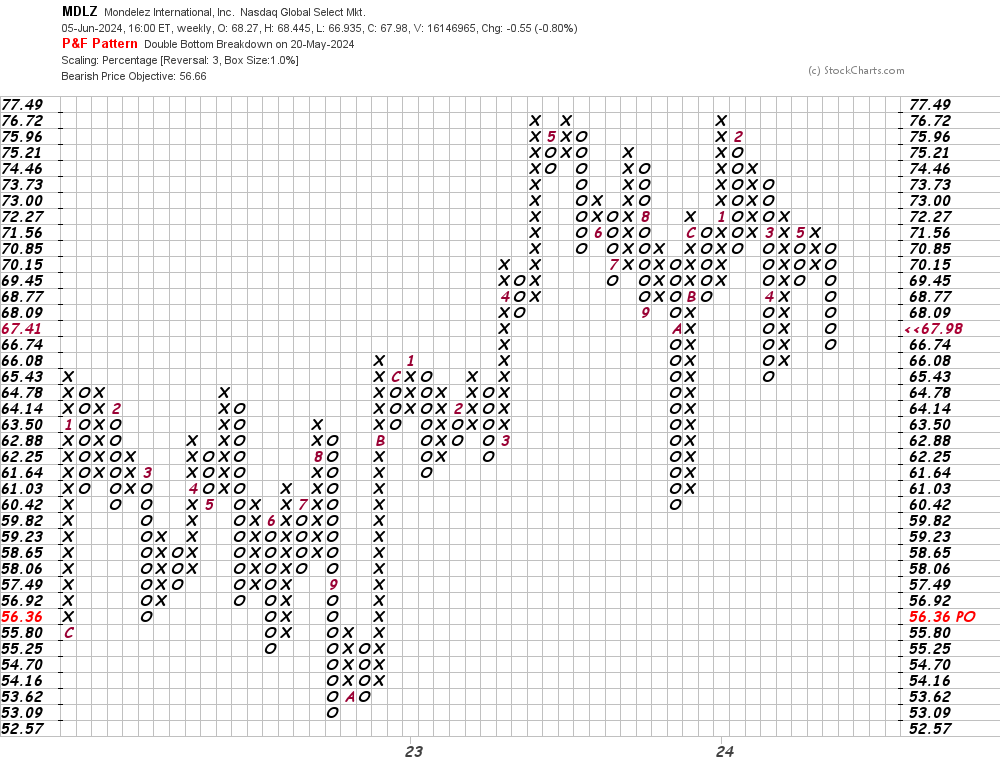
In this weekly Point and Figure chart of MDLZ, below, I see a downside price target in the $57-$56 area.
Bottom-line strategy: I am torn between my desire to eat snacks between meals and my need to lose some weight. Decisions. Decisions.
Traders and dieters should avoid the long side of MDLZ for now.
Employees of TheStreet are prohibited from trading individual securities.