Investors Are Getting Greedy While Breadth Starts to Weaken
Let's take a look at investor sentiment at a time when breadth is beginning to weaken. Plus, BDX, COIN, MCD, TSM, GS, HUN, HII, and MLM.
You've reached your free article limit
You've read 0 of 1 free Pro articles.
The Market
Another day with the market levitating, so let’s talk statistics because they are not getting better the more we go up.
Breadth was good, not great. Quite frankly, it started the day out much better than it ended. And it wasn’t enough to turn the McClellan Summation Index back up. That requires another day of positive breadth.
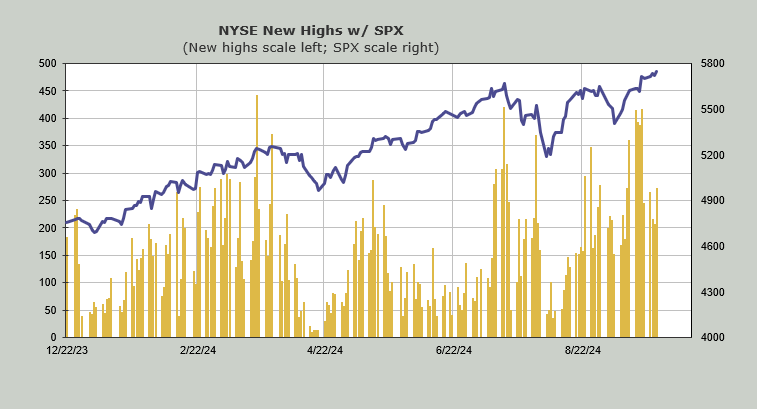
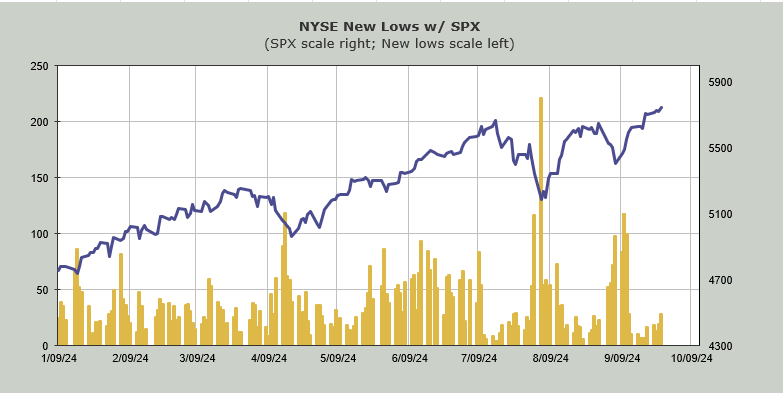
Then, there are the stocks making new highs. The NYSE had 271. Two weeks ago, there were 415 new highs. A week ago, there were 417 new highs. New lows on the NYSE also expanded, which quite frankly surprised me. They now number 28. That is a low number, but it’s the most we’ve had since September 12th.
It’s not like Nasdaq is burning up the town, either. Sure I have liked the semis but 287 new highs on Nasdaq when there were 408 a week ago is also not great. Neither is the 125 new lows.
I would say that this is the time of year that we typically see new lows expand (tax loss selling) but usually that happens on down days not up days.
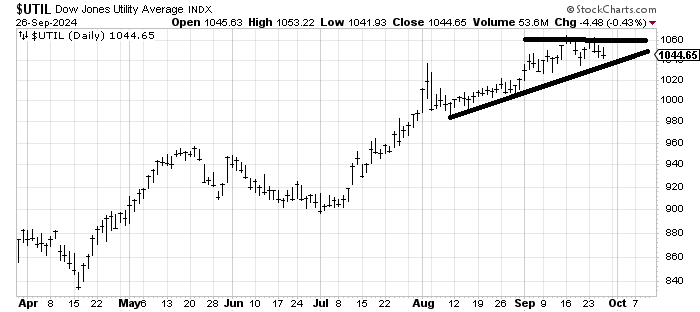
Then there are the Utes. I know I am harping about them, but I have always thought they are important. They haven’t made a higher high in weeks and are basically back where they were in early September. I’m closely watching that uptrend line because a break of that 1030 area would be bearish.
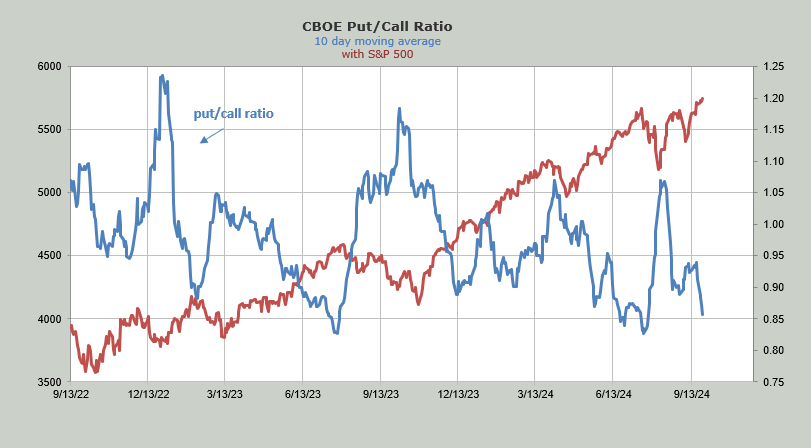
Finally, there is the put/call ratio which we looked at last night and will do so again tonight. As you can see, it’s been trending down on the ten-day moving average. It hasn’t yet cracked under .85 (the equity put/call ratio hasn’t yet broken .56, which is the line I am watching there), but it’s close. (See Today's Indicator)
Sticking with sentiment, the CNN Fear and Greed, which I am not a staunch fan of, but I do look at it, is now knocking on the door of extreme greed. You can view it here. https://www.cnn.com/markets/fear-and-greed
The DSI for the VIX is now 17 (it had gone up two days ago) and the DSI for Nasdaq is 82.
The market did not give us any volatility this week as I expected. We only saw it in the small caps, but that doesn’t mean I think this is a healthy market. Markets should correct, it keeps them from getting extreme.
New Ideas
There is a lot of chatter about China now (naturally!), so let’s look at the KWEB chart again, this time a three year chart. You can see it crossed the downtrend line (bullish), but what I want you to see is that the volume has surged. Notice it is black not red like the other two surges.
I often discuss high volume lows on the QQQs and you can see how it’s no different for KWEB. But what about a high volume breakout? It probably means short term it’s overdone as it screams to me ‘get me in’, be it from shorts or new longs. So, yes, I would take something off the table, but as long as it stays over 30 it ought to be okay on an intermediate term basis.
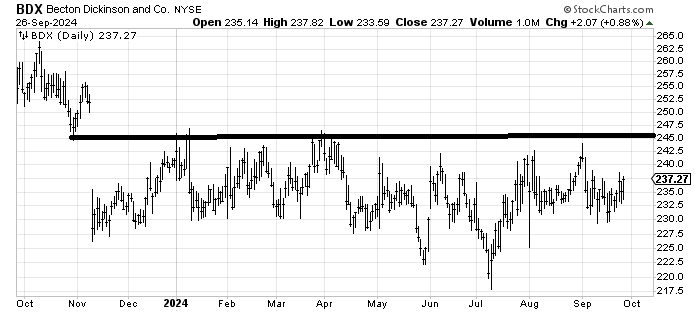
I am always drawn to down and out stocks, so naturally Becton Dickinson BDX caught my eye. It actually looks a bit like that Twilio TWLO chart that I have liked for a while.
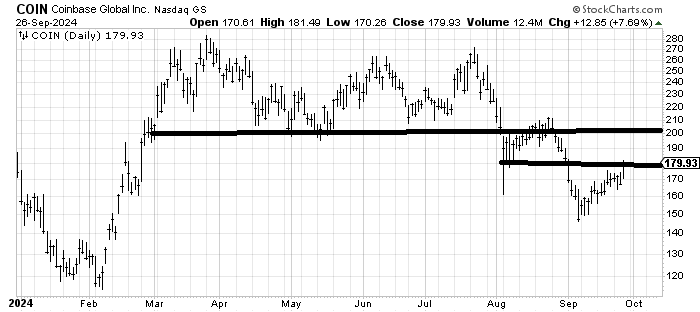
For those who asked for a follow up on Coinbase COIN, the first target was right here around 180. The other one is in that 190-200 area.
Today’s Indicator
The ten-day moving average of the put/call ratio is discussed above.
Q&A/Reader’s Feedback
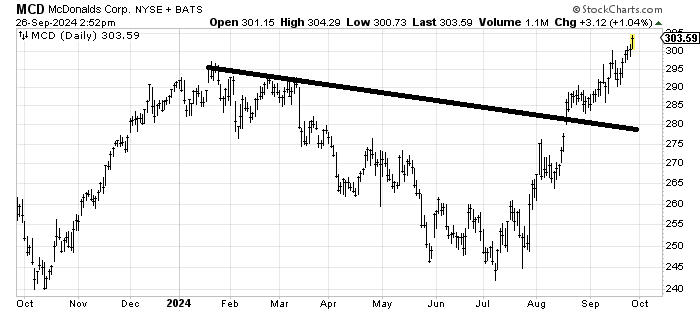
McDonald’s MCD has a measured target in the 330-ish area. Is it over extended now? Sure, a little bit. Can it correct in the next few weeks? Probably. But, thus far, it has done nothing wrong.
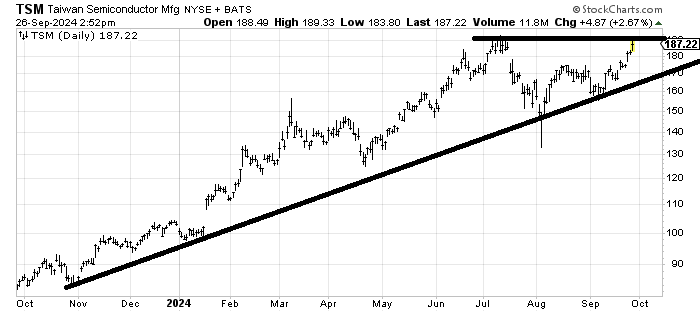
Taiwan Semiconductor TSM has a short-term measured target in the 190 area. I would love to see it pull back toward the 175-ish area. Alternatively, it crosses this line around 190 and rallies a few bucks and then pulls back to the line. I’m in favor of the first scenario because I prefer when stocks pull back first.
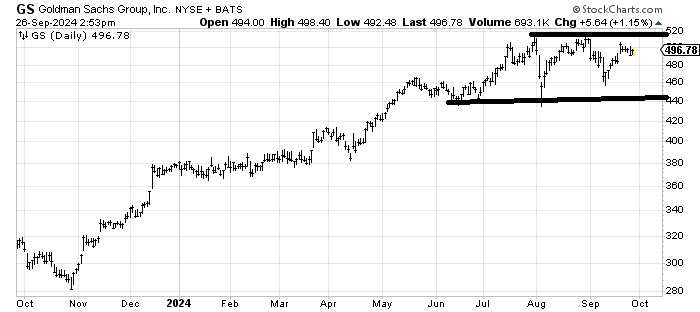
I am undecided on the chart of Goldman Sachs GS because it has gone nowhere in months. My inclination is that it has another rally toward that 520 area left in it, having filled the gap left from the post Fed rally.
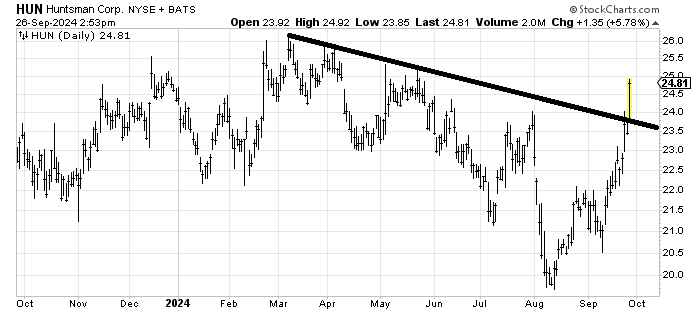
Huntsman HUN broke the downtrend line that has been in place since March. It has plenty of resistance all the way up to the old highs but I would be interested in buying a pullback toward the line around 23.50-24..
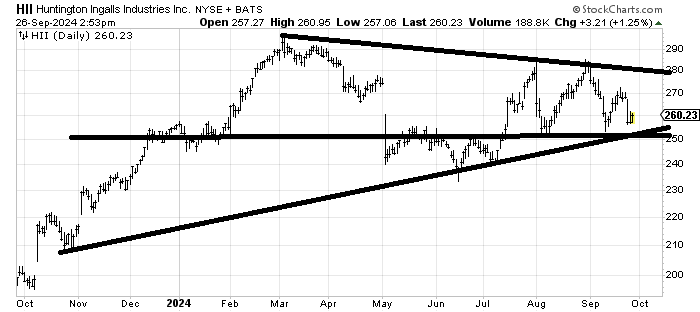
Huntington Ingalls HII had better hold 250. In fact, if it got down there, the risk/reward would be decent because you know where you’re wrong pretty fast. Aside from that, the stock looks like it’s just sloshing about, directionless right now.
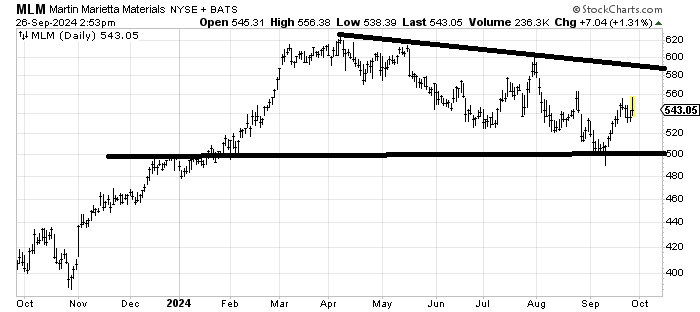
Martin Marietta Materials MLM could develop into a better chart but it looks like it still needs some work. Either it needs to go sideways for another month or so (at least a few weeks) or it needs to get up and over 560 because right now it is struggling to clear that late August high. Yet I can see myself warming up to it a few weeks/months from now, as that action from the fourth quarter last year falls off the chart, this starts to look more like a basing chart.