How to Trade the SoFi Breakout
This stock has bullish momentum on its side, but how high will it rise? A recent Supreme Court decision certainly doesn't hurt its prospects.
You've reached your free article limit
You've read 0 of 1 free Pro articles.
Occasionally, a decision by the Supreme Court has a dramatic impact on a stock’s price. It doesn’t happen often, but that’s exactly what occurred earlier this week.
The decision caused at least one stock to break out to multi-month highs. And according to that stock’s chart, the rally could continue.
The company, San Francisco-based SoFi Technologies SOFI, offers loans, credit cards, and investment products. The financial services company, founded at Stanford University in 2011, boasts 8.8 million clients.
Why did SoFi climb by 7.2% on Thursday? One of SoFi’s income streams involves servicing student loans. Some analysts are speculating that Wednesday’s U.S. Supreme Court decision to reject the Biden Administration’s student debt relief plan is having a positive impact on the stock.
Whether or not SoFi’s gain was entirely attributable to the Supreme Court’s decision is debatable. What isn’t debatable is the fact that the stock has broken out to a five-month high. This is a tradable breakout, but not necesarily a long-term investment.
On SoFi’s daily chart, we see the stock has closed at its highest point since March 4. Earlier this month, SoFi climbed above its 50-day (blue) and 200-day (red) moving averages, a bullish momentum signal. Thursday’s move occurred on strong volume, potentially signaling the involvement of institutional investors.
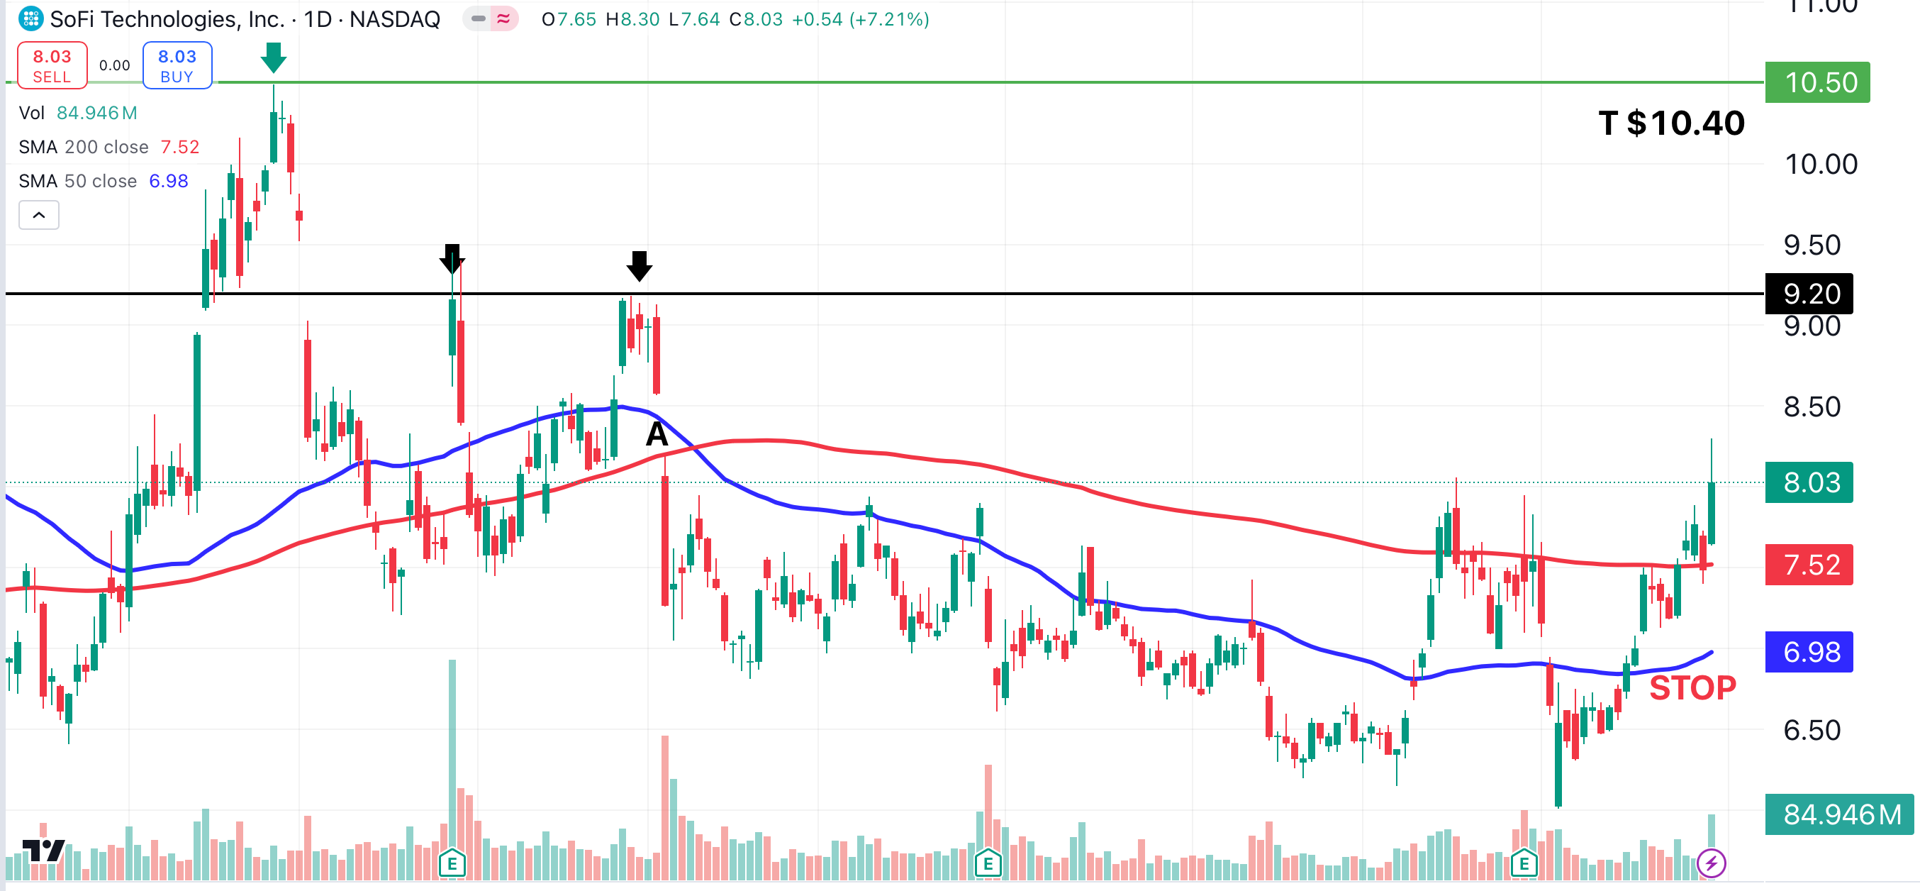
SoFi’s next task is to fill the March 5 gap (point A). The stock faces significant resistance at $9.30 (black horizontal line), the scene of multiple rejections earlier this year (black arrows) . Further resistance lies at $10.50 (green horizontal line), a major high point from December of last year (green arrow).
A rally of 8% from Thursday’s closing price would be sufficient to fill the gap. A 16% rally would bring the stock to its next major resistance level of $9.30.
Based on this chart, my target price for the stock is $10.40 (T). That figure represents a 30% gain from Thursday's closing price. It would also place the stock just shy of a major resistance level, making it a smart place to exit the trade.
My protective stop is located just below the stock’s 50-day moving average (blue), which is turning higher. My plan is to tighten the stop manually, while keeping it just below that moving average, which I’m hoping will continue to rise.
If the 50 MA turns lower, it’ll most likely signal a failed breakout, and an early exit from the trade. As always, risk management remains our top priority.
More Trading Basics
- The Most Important Thing I've Learned in 25 Years of Trading
- Day Trading Is Very Difficult: Here Are 6 Tips for Long-Term Success
- Everything You Ever Wanted to Know About the CNN Fear & Greed Index
At the time of publication, Ponsi was long SOFI.
