How Far Can This Low-Priced Silver Stock Rally?
Shares have more than doubled in a short period, suggesting strong and increasing buying interest.
You've reached your free article limit
You've read 0 of 1 free Pro articles.
Endeavour Silver Corp. EXK is a mining company focused on discovering and mining silver, with projects and operations in Mexico, Chile and the United States. The shares have soared in recent weeks and more investors are believing the narrative that precious metals are in a new and sustainable bull market.
My last review of EXK was more than a year ago and unfortunately the stock declined to new lows instead of making an upside breakout.
Let's check out the charts and indicators again as the precious metal landscape has changed significantly.
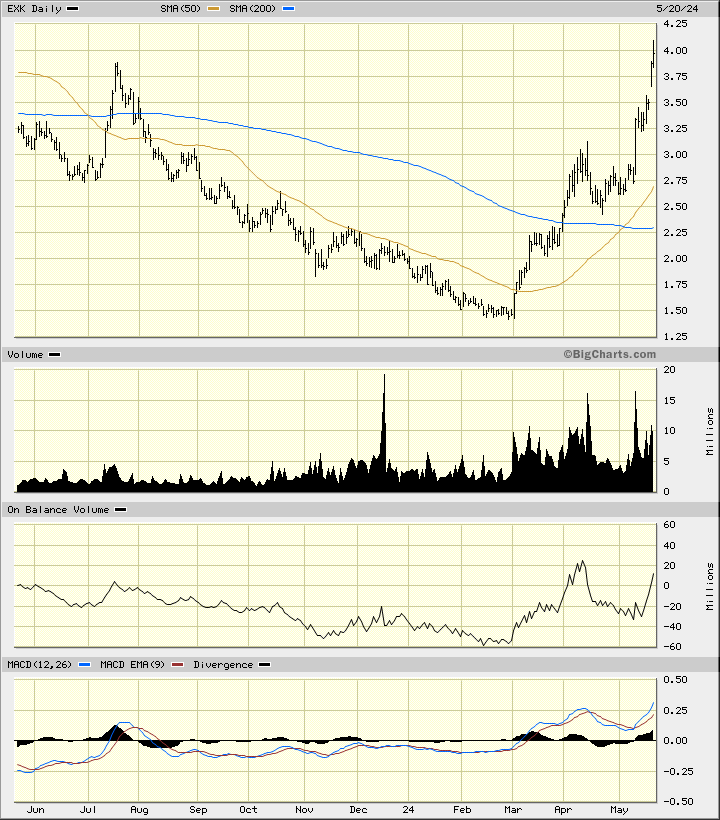
In this daily bar chart of EXK, below, I can see that the shares have more than doubled in a short period of time. This kind of price movement suggests strong and increasing buying interest.
The trading volume has been very heavy in the last three months. The daily On-Balance-Volume (OBV) line shows a new bullish trend since February. The Moving Average Convergence Divergence (MACD) oscillator is in a bullish alignment above the zero line.
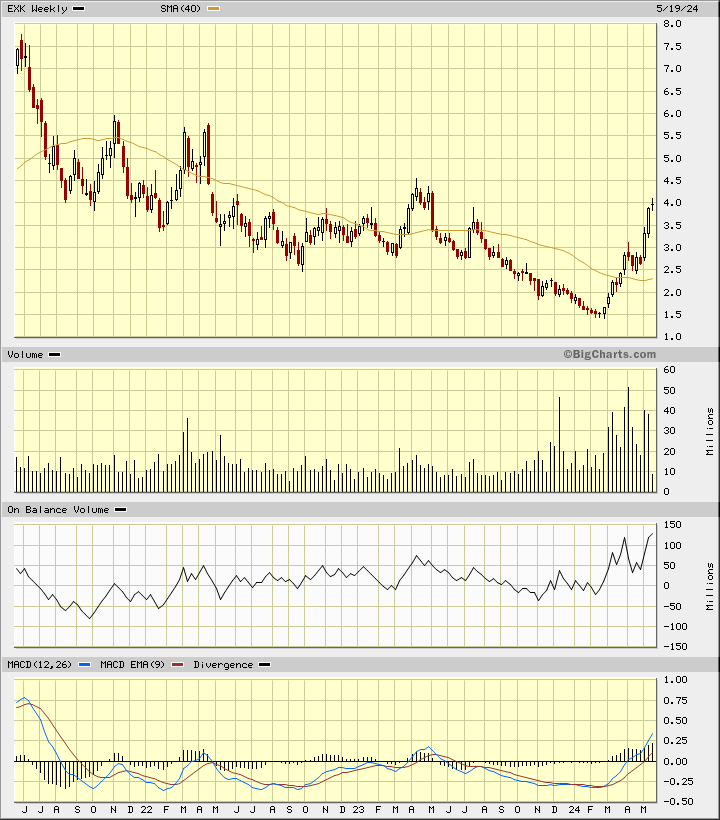
In this weekly Japanese candlestick chart of EXK, below, I see a promising setup. Prices look like they are finally breaking a longer-term downtrend. EXK trades above the bottoming 40-week moving average line.
The weekly trading volume histogram shows us a strong increase in turnover over the past six months so we know that some serious money has moved into this name. The weekly OBV line shows strength since November.
The MACD oscillator is in a bullish alignment above the zero line. Strength above $4.50 should open the way to further gains. The candles are not showing any signs of a top reversal yet.
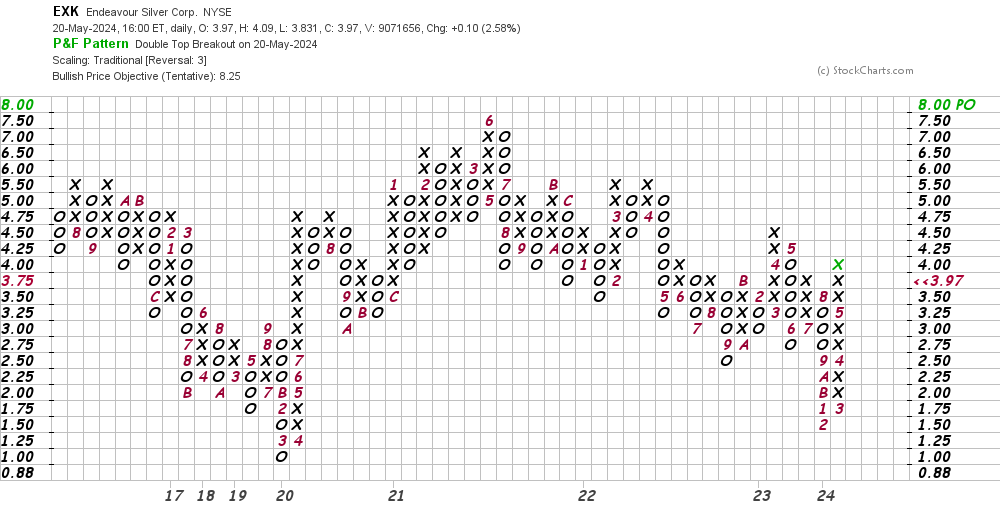
In this daily Point and Figure chart of EXK, below, I can see a potential upside price target in the $8.25 area.
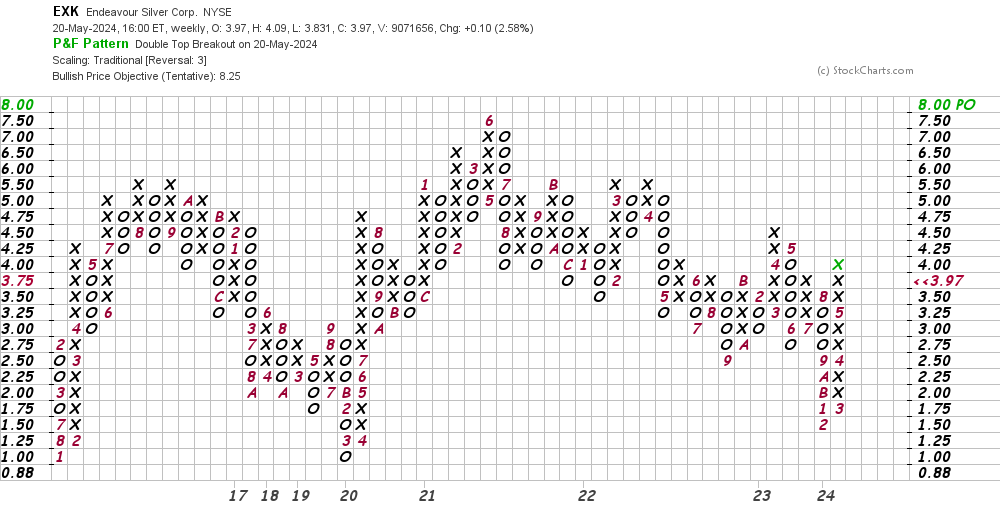
In this weekly Point and Figure chart of EXK, below, I can see the same price target in the $8.25 area as shown on the daily chart above. A weekly trade at $8.00 will be a longer-term upside breakout on this chart.
Bottom-line strategy: EXK has made a big rally in a short period of time. A pullback or some kind of correction would be expected but sometimes in the powerful early stages of a rally buyers are forced to chase prices higher and higher before a correction unfolds. Use any sideways price action to build a long position.
Employees of TheStreet are prohibited from trading individual securities.