Has Foot Locker Lost a Step? Let's Jump Right In
Let's take a look at the charts.
You've reached your free article limit
You've read 0 of 1 free Pro articles.
Foot Locker FL was upgraded to buy from hold at Evercore ISI, with a price target of $32. The company has no lack of competitors including Nike NKE, Adidas ADDYY, Dick's Sporting Goods DKS, Hibbett HIBB, and Finish Line.
Let's check out the charts and indicators.
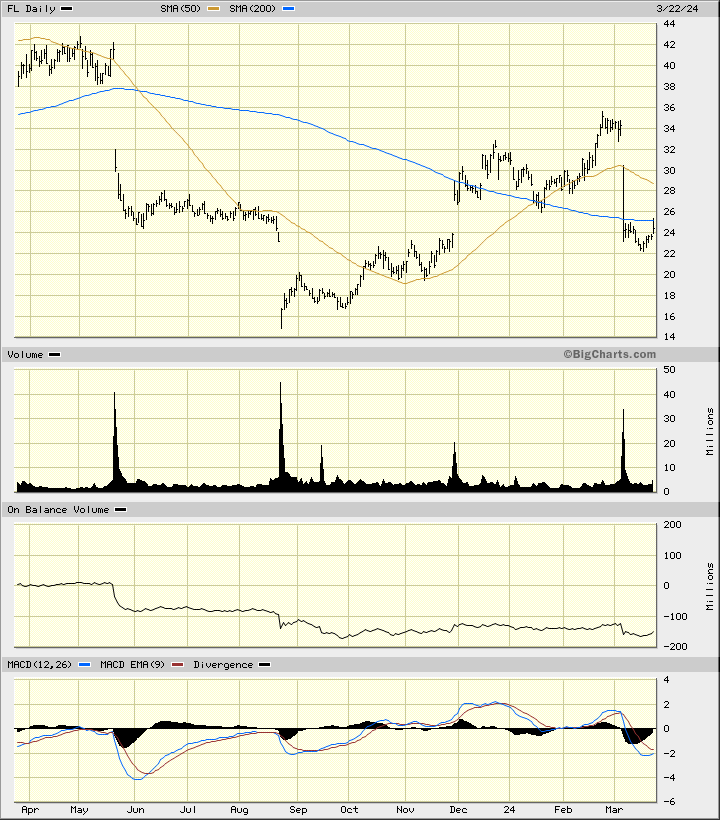
In this daily bar chart of FL, below, I can see a lot of price gaps - on the upside and the downside. All of these gaps make me a little uncomfortable with this stock.
Prices made a low in late August and have rallied but notice the movement in the On-Balance-Volume (OBV) line - it has remained flat which tells me there is little to no aggressive buying of the stock.
The Moving Average Convergence Divergence (MACD) oscillator is below the zero line telling me that this stock lacks "trend strength".
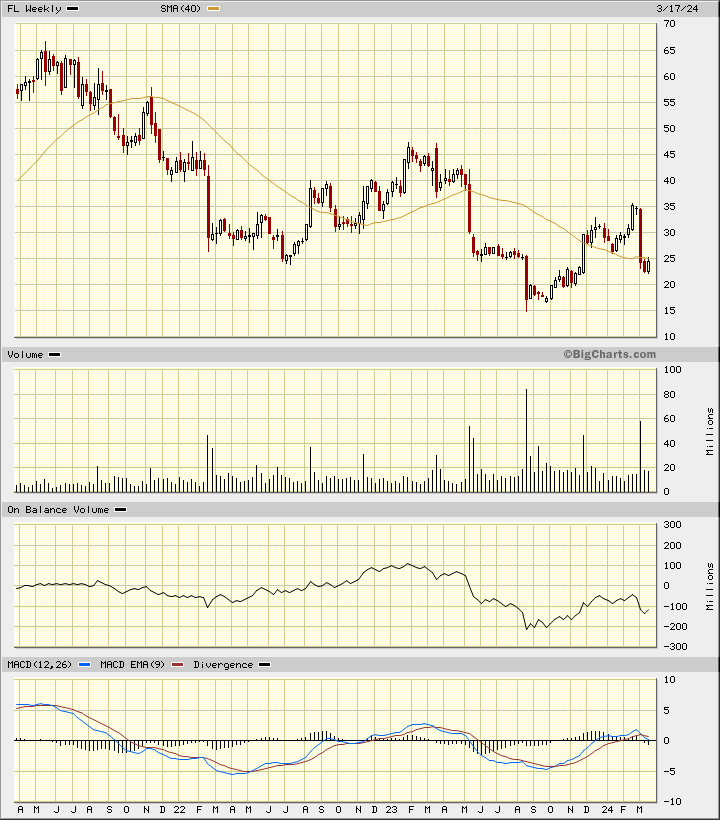
In this weekly Japanese candlestick chart of FL, below, I can see that a downtrend has dominated over the past three years. Prices are trading around the downward sloping 40-week moving average line.
The weekly trading volume has been more active since September but the OBV line has not acted all that strong. The MACD oscillator has crossed to the downside and is only a fraction above the zero line.
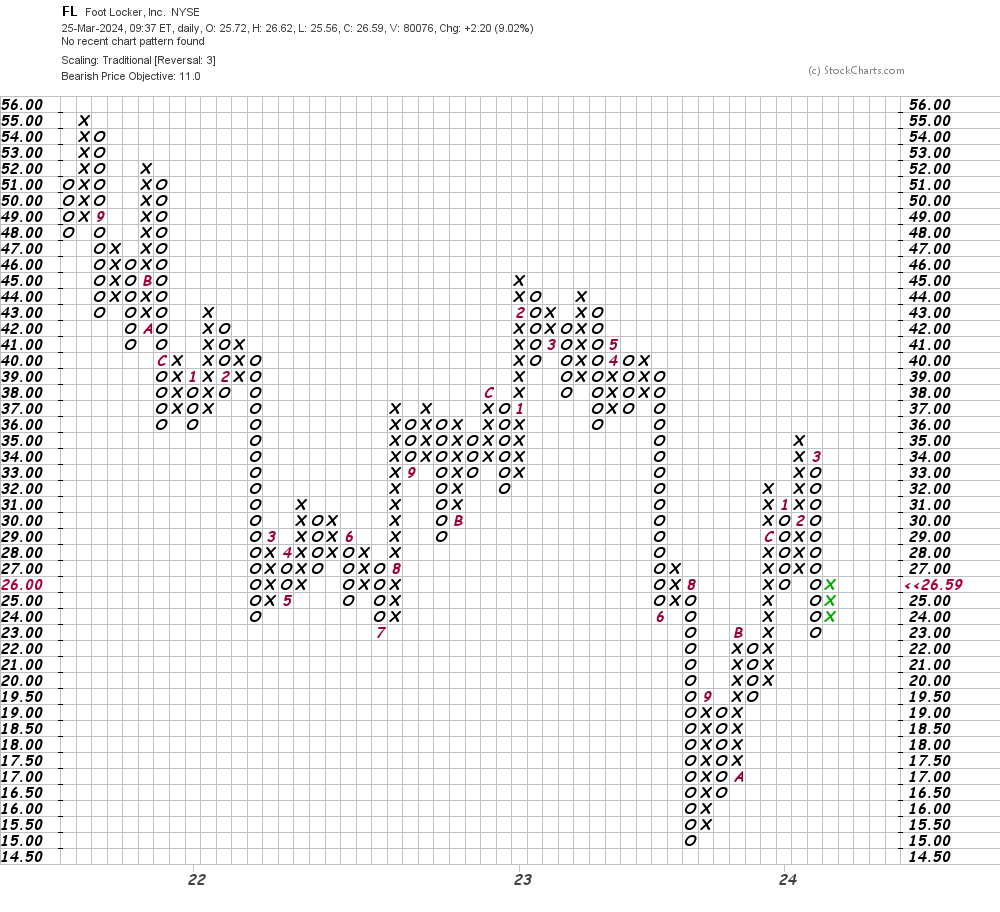
In this daily Point and Figure chart of FL, below, I can see a downside price target in the $11 area.
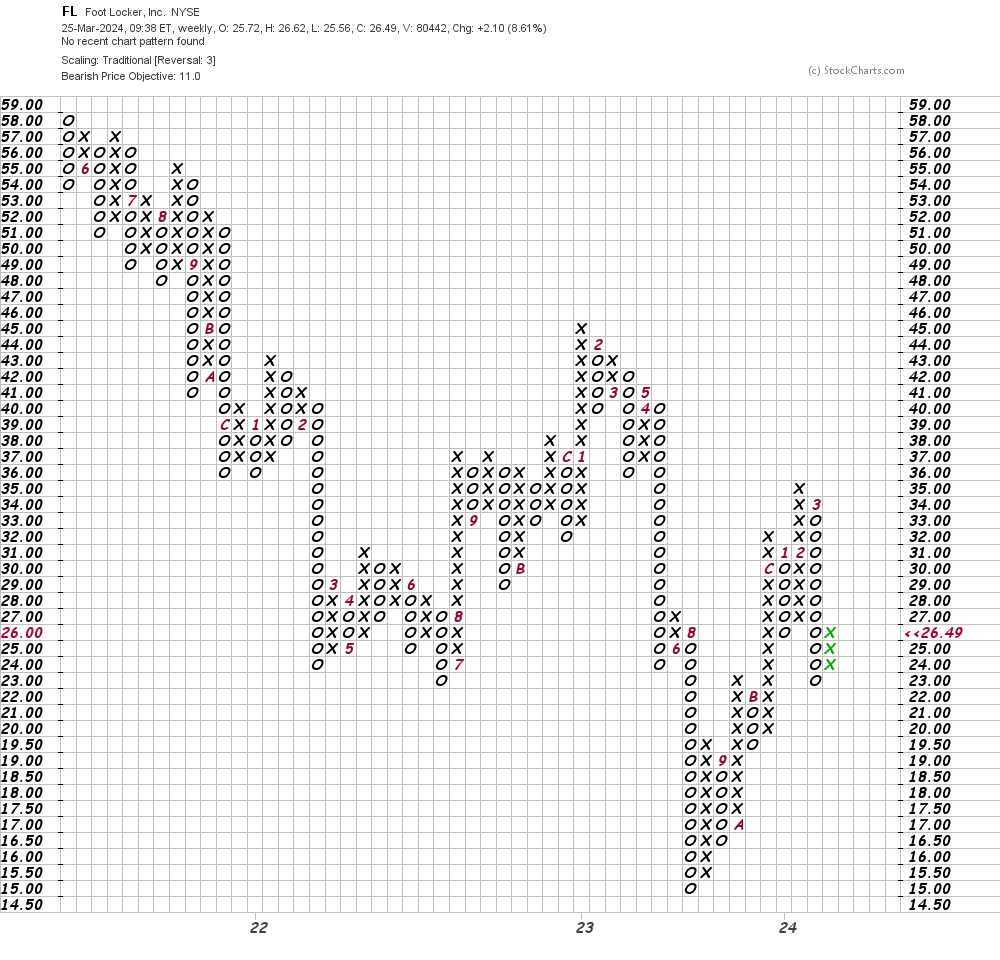
In this weekly Point and Figure chart of FL, below, I can see a downside price target of $11.
Bottom line strategy: I have a teenage grandson active in sports and growing out of sneakers before they are broken in. I should ask him what he thinks of FL. In the meantime, I would avoid the long side of FL as the charts suggest we could see further declines.
Employees of TheStreet are prohibited from trading individual securities.