Wall Street Titan Is Back With $2.9 Trillion Record
One of the world's largest financial firms impressed with its latest financial results, but is there a trade to be made?
You've reached your free article limit
You've read 0 of 1 free Pro articles.
Wall Street titan Goldman Sachs GS released the firm's second quarter financial results early on Monday morning. The results were pretty darned good. For the three-month period ended June 30, 2024, Goldman Sachs posted a GAAP EPS of $8.62 on revenue of $12.731 billion. These top- and bottom-line numbers both beat Wall Street, while the top-line print was good for year-over-year growth of 16.9%. The growth was largely reflective of increased sales and fees in Global Banking & Markets and Asset & Wealth Management. Provisions for credit losses for the quarter dropped to $282 million compared to $615 million for the year ago period.
Assets under supervision reached a record $2.93 trillion after groping by $86 billion during the quarter. Total loans printed at $184 billion for the second quarter in a row, up from $178 billion for the year ago comparison. Net interest income printed at $2.24 billion, simply blowing away expectations for something down around $1.65 billion and up from $1.68 billion for the year ago comp.
As for the ratios, Goldman's standardized CET1 capital ratio improved to 14.8. For the quarter, return on average common shareholders' equity (ROE) improved by 6.9 percentage points to 10.9% and the return on average tangible common shareholders' equity (ROTE) improved 7.2 percentage points to 11.6%. On top of all of that, Goldman's efficiency ratio (non-interest expenses divided by revenue) improved by 11.4 percentage points to a very strong 67%.
Segment Performance
- Global Banking & Markets: Revenue generation grew 14% to $8.184 billion, as investment banking fees increased 21%, fixed income trading and financing revenue increased 17% and equities trading revenue increased 7%. This produced net earnings of $2.458 billion (+18%), as provisions of $-55 million were made for credit losses.
- Asset & Wealth Management: Revenue generation grew 27% to $3.878 billion, as consumer platform driven revenue increased 4%, but transaction banking revenue suffered a 15% decline. This produced net earnings of $700 million, as provisions of $-58 million were made for credit losses.
- Platform Solutions: Revenue generation grew 2% to $669 million, as asset management driven revenue increased 7%, wealth management driven revenue increased 8% and debt/equity investment revenue increased dramatically from being not meaningful a year ago. This produced net earnings of $-115 million, as provisions of $395 million were made for credit losses.
The CEO
From Monday's press release, CEO David Solomon commented: "We are pleased with our solid second quarter results and our overall performance in the first half of the year, reflecting strong year-on-year growth in both Global Banking & Markets and Asset & Wealth Management. Our One Goldman Sachs operating approach is allowing us to bring the whole firm to our clients, deepening our relationships and serving them in an improving, but complex environment."
My Thoughts
This was an impressive quarter. Is Goldman really back to being Goldman? Some might argue they already were, in the way the shares have behaved in 2024. The growth in asset and wealth management is strong. The growth in profitability in Global Banking & Markets just as much. If one needs to nitpick, the numbers did reflect sequential declines, but almost everything improved year over year. Additionally, the firm declared a $3 per share quarterly dividend payable September 27, 2024, to shareholders of record on August 30, 2023. This is a 9% increase in the payout and brings the stock's forward yield up to 2.5%.
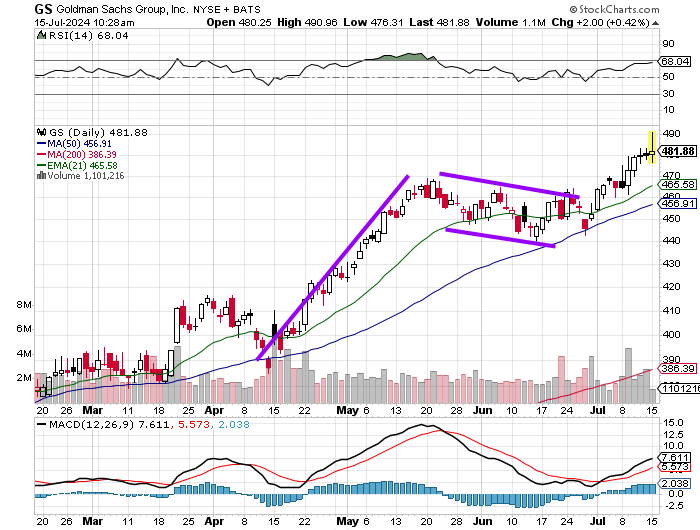
What I think I see here is a bullish flag that runs from mid-May into late June that developed after a mid-April into mid-June flagpole. We see that flagpole basically ran from $390 to $470, which makes $470 the pivot. Generally, if one is sure they have a bull flag, the breakout is thought to target a distance similar to the flagpole. That would make the target, in this case $550. If long, or entering, I would think about using the 50-day SMA as a panic point or mental trailing stop if broken. I am not in this name now, but I am likely to play this trade in small to small-medium size myself once this article is public.
At the time of publication, Guilfoyle had no positions in any securities mentioned.
