Concerning Gap Persists for American Express, Urging Investor Caution
The financial services giant reported a solid quarter, but a closer look at the stock charts raises a red flag.
You've reached your free article limit
You've read 0 of 1 free Pro articles.
American Express AXP reported Friday morning for what looks like a solid quarter where revenues were up 9%, but there was a slight miss versus expectations according to analysts. EPS was much better than expected and they also lifted their 2024 earnings outlook.
Let's check out the charts and indicators.
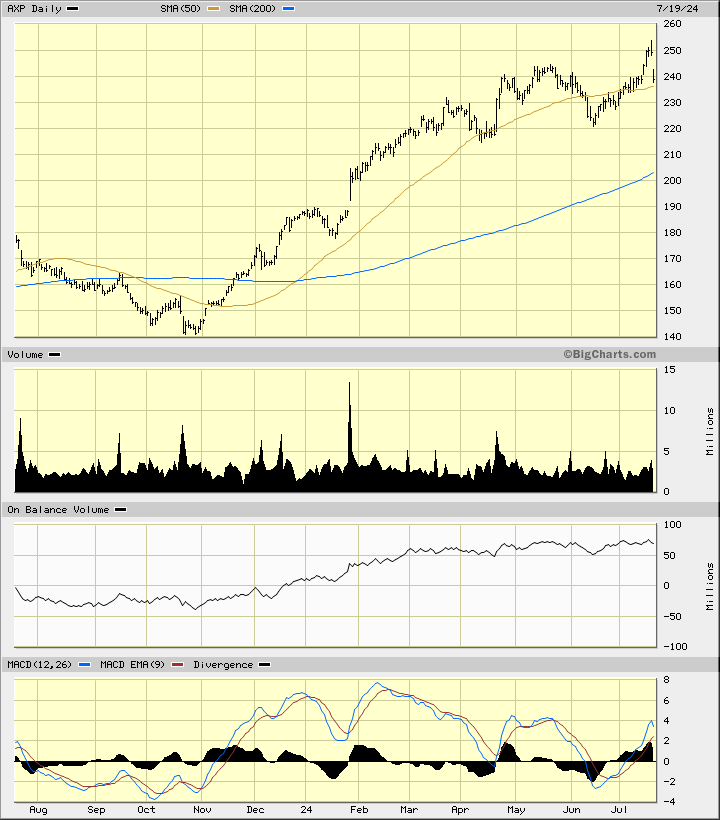
In this daily bar chart of AXP below, I can see that prices rallied ahead of earnings this morning. Traders were anticipating a bullish report and may have become sellers when the news did not measure up. Prices have pulled back the rising 50-day moving average line. The On-Balance-Volume (OBV) line has moved sideways the past three months and has created a bearish divergence when compared to the price action making higher highs. The Moving Average Convergence Divergence (MACD) oscillator has been making lower highs since February and tells me that the trend-strength has been weakening.
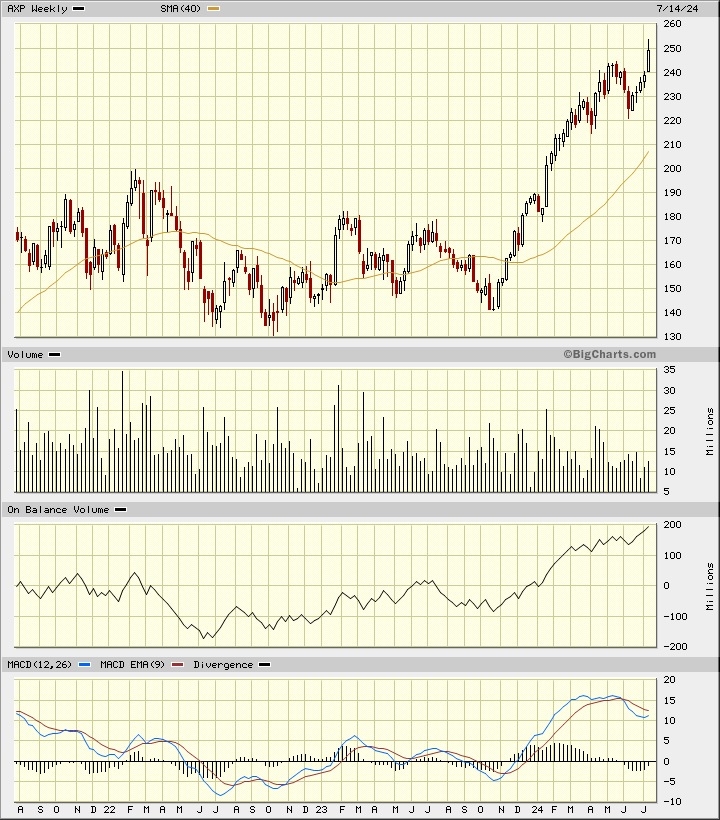
In this weekly Japanese candlestick chart of AXP below, I can see a two-year sideways trend before prices surged to the upside. Prices now trade above the rising 40-week moving average line. The weekly OBV line has been on an upward path the past two years. The MACD oscillator began to weaken in May.
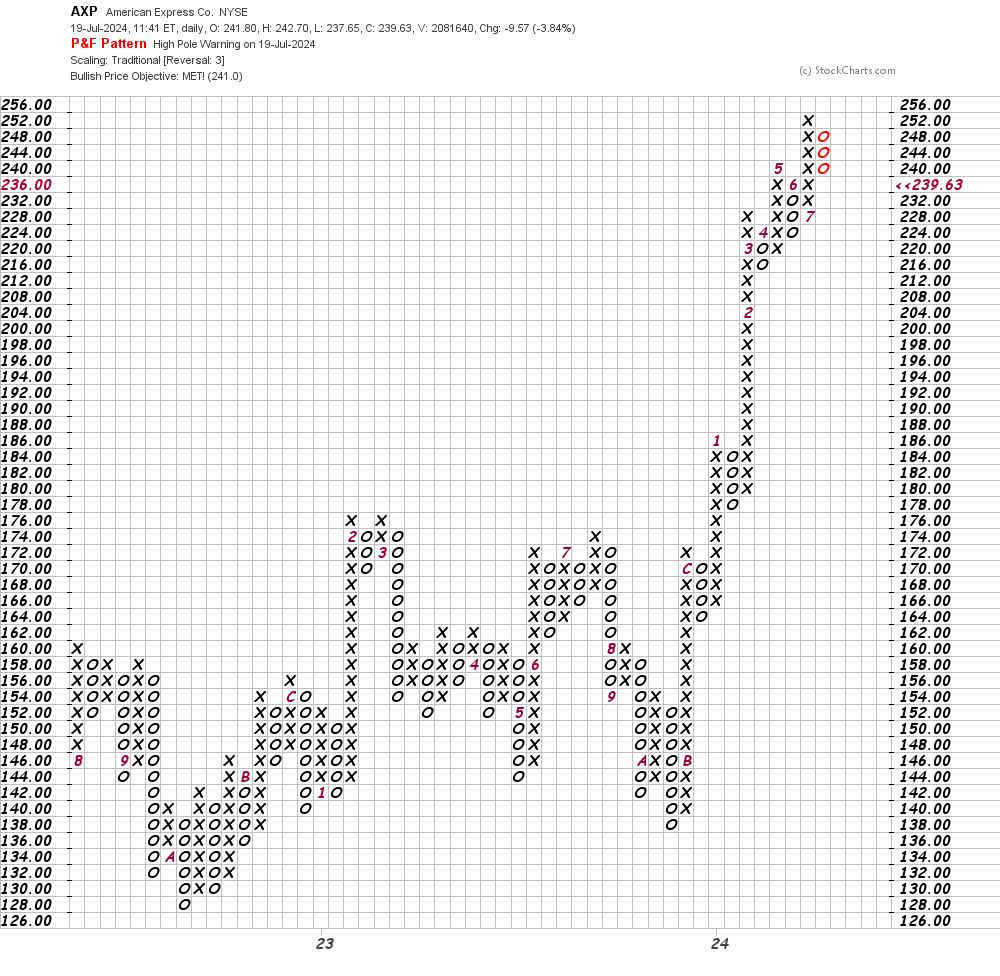
In this daily Point and Figure chart of AXP below, I can see that prices reached and exceeded a price target in the $241 area. A trade at $224 could begin to weaken this chart.
In this weekly Point and Figure chart of AXP below, I can see a chart that is similar to the daily chart above.
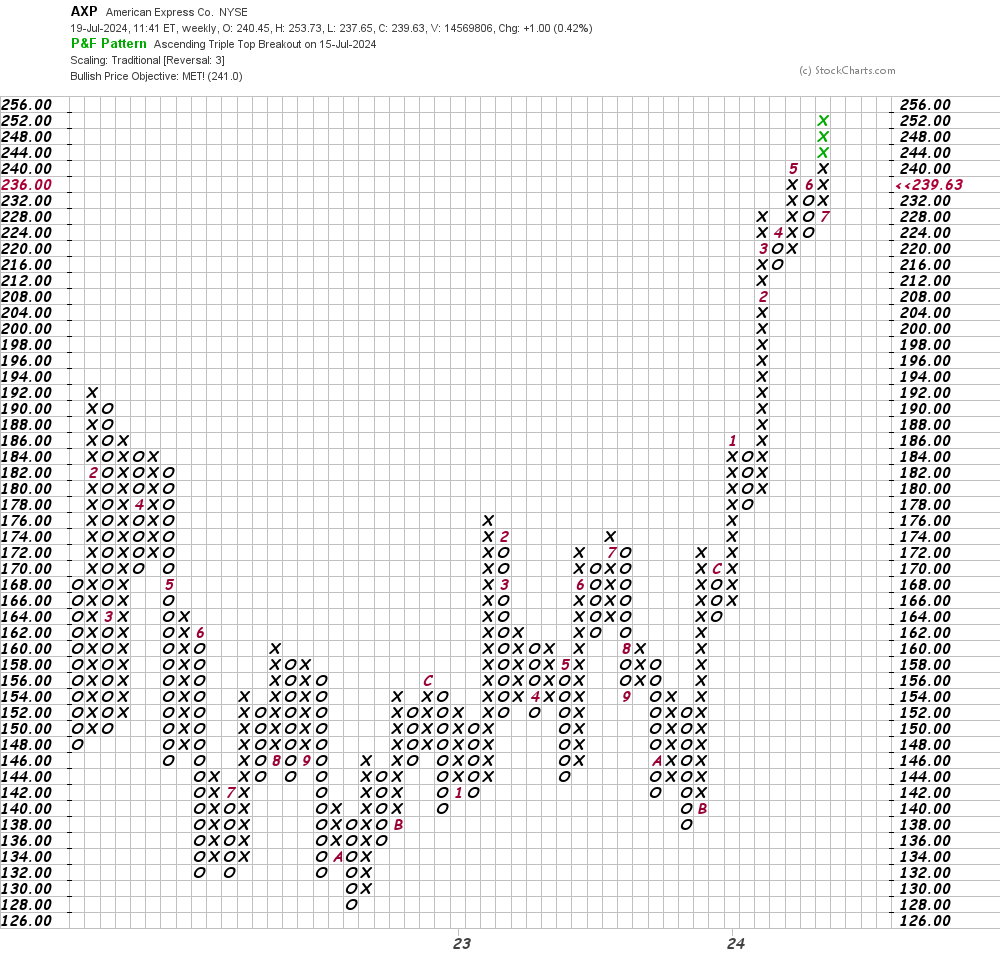
Bottom line strategy: AXP gapped lower Friday. The longer the gap remains intact, the weaker the chart becomes, in my opinion. A trade at $224 on the Point and Figure chart starts to weaken things and a break of the June low around $220 would not be a good development.
Employees of TheStreet are prohibited from trading individual securities.