Follow These 3 Charts to See if the Rally Will Continue
I’m expecting an oversold rally this week. The question is, will it be successful? It depends on these three charts.
You've reached your free article limit
You've read 0 of 1 free Pro articles.

The Market
I am terrible at market narratives. If you ask me what reason the market will rally or will decline, I can often make something up, but what is the use? In my opinion, if the market is set up for a rally or a pullback/decline, the news, whatever it is, will somehow, someway, manage to fit.
I thought of this last week because, as you know, I thought the market was setting up for an oversold rally this week. On Thursday, it reversed from down to up on news of an agreement to end the war with Iran. Did that news arrive earlier than anticipated based on the oversold condition? Sure. But was some good news unexpected? It was not.
So where does that leave us now? I still think it leaves us leaning toward a short-term oversold condition. I still think if we see a pullback early this week, we should rally again. But I do not expect this to be similar to the rally off the late March low.
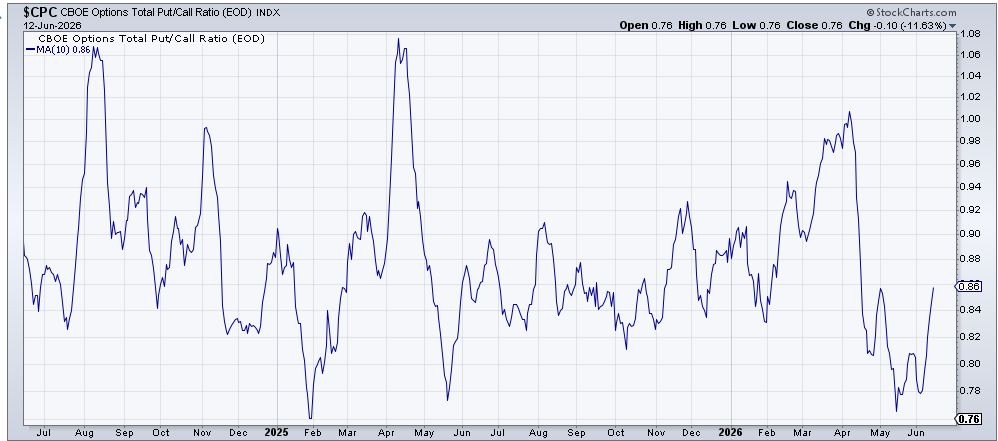
The reasoning is thus: we are not nearly as oversold now as we were then, and sentiment is a far cry from where it was then. Just look at the ten-day moving average of the put/call ratio. In late March, this metric was pushing up over 1.0. Now it is at .86, coming off a low reading of .77. And on Friday, we already saw the enthusiasm enter the picture with the reading down at .76. So if we rally this week and folks get enthusiastic, this could fall back down quickly.
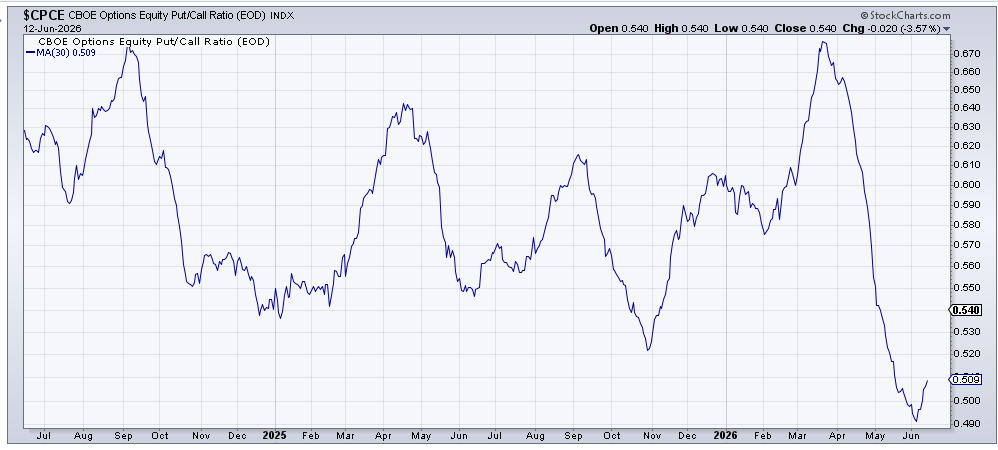
Or look at the 30-day moving average of the equity put/call ratio. In late March, this was over .67. Now it has just bounced off .49 (and is currently .51). The setup is just not the same.
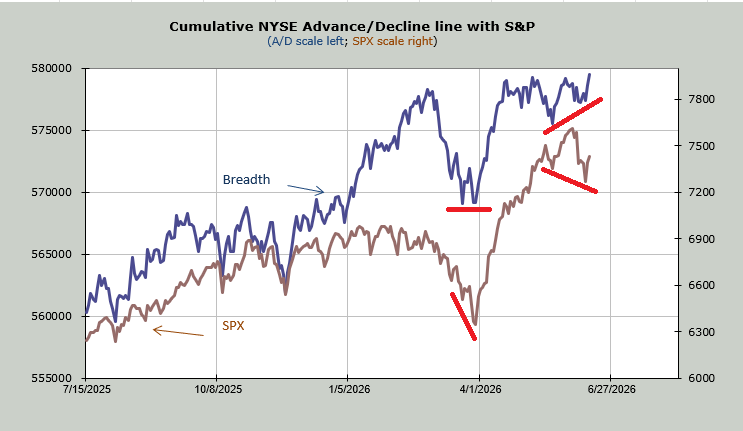
There is something that is similar, though, and that is breadth. I have commented how breadth has been better than the indexes (either/or) in this early June swoon. In late March, as the S&P swooned from 6500 to 6300 (brown) breadth (blue) did not participate on the downside.
Now we have the S&P making a lower low than mid-May, while breadth came nowhere near its mid-May low. Can it be that the others get their day in the sun while the big-cap index-movers take a back seat?
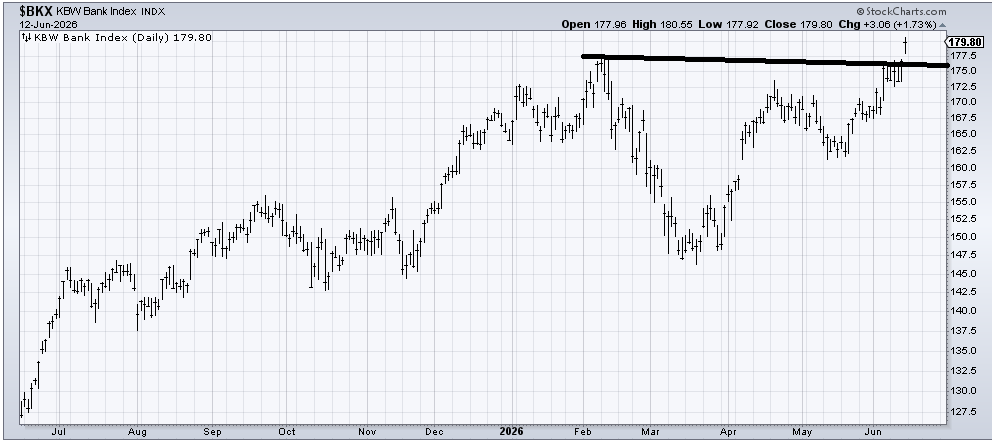
While everyone fussed over SpaceX and tech on Friday, the Bank Index not only made a new high but gapped up over it. I warmed up to the banks a few weeks ago with my recommendation on Citigroup, but this is the chart I will continue to focus on. It needs to stay up and over that 173 area. And please, let’s hope the chatterers continue to care about tech and not the banks.
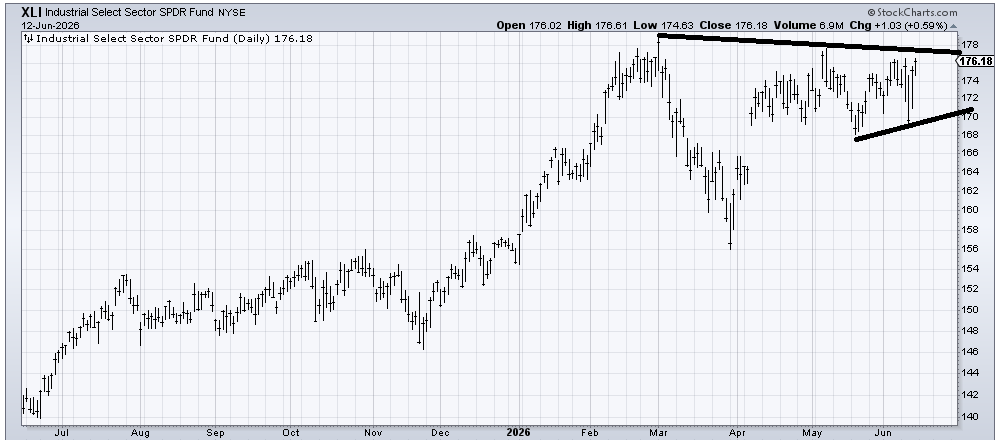
But the other chart that has my attention is XLI, an ETF to be long the industrials. A breakout here (over 178-ish) would be an indication to me that the others will drive the bus for a time.
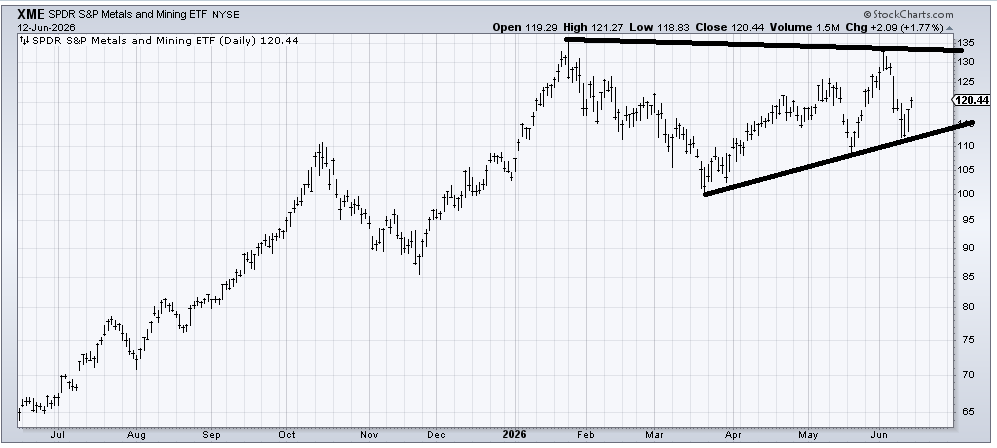
Finally, there is XME, an ETF to be long metals and mining. I liked this chart several weeks ago. We had a pop and then a drop, so it’s right back where I originally liked it. This chart needs to hold over 110. A break under there and it’s bearish.
If these charts cannot break out, then I expect the oversold rally in the others will be very short-lived.
New Ideas
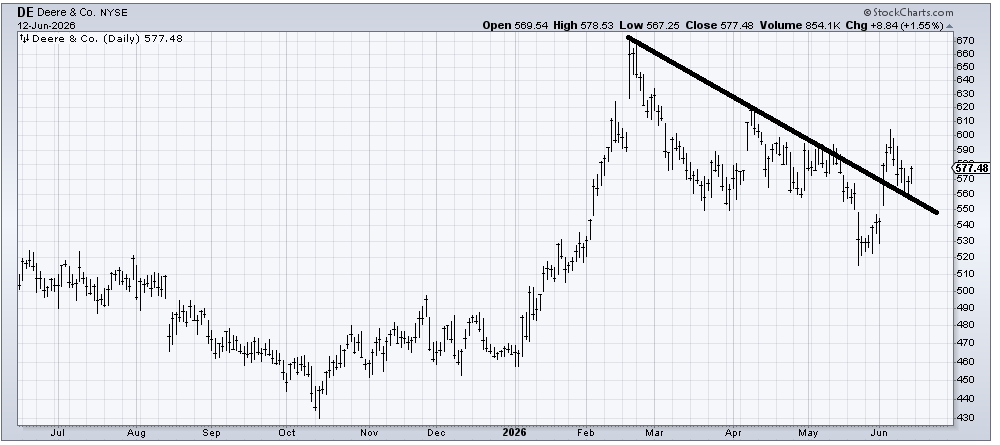
One industrial stock I have my eye on is Deere (DE). I was asked about it a few weeks ago when it was near 530 and thought it was oversold enough to rally to resistance. It did that, but has since pulled back to test the line it crossed. A stop under 540 seems too far away, but it’s possible this is now setting up a head and shoulders bottom, or at least a rally back to that 600-620 area.
Today’s Indicator
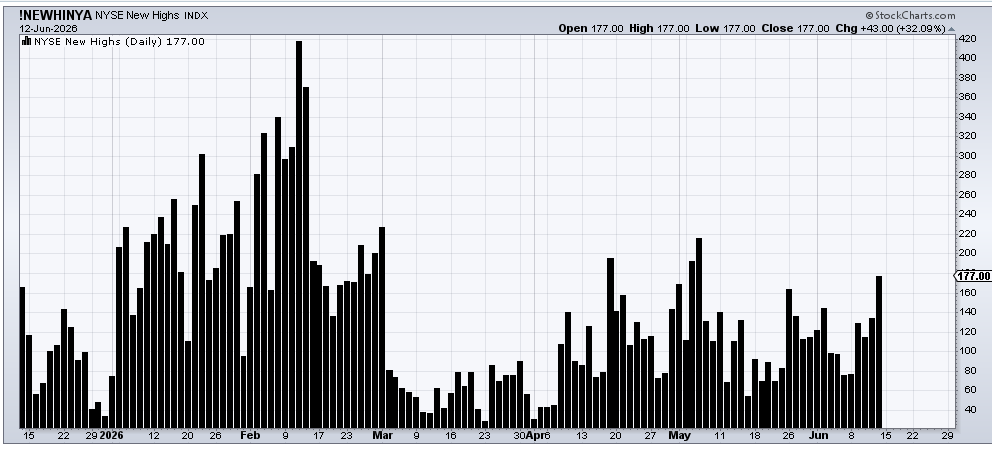
The new lows began contracting last week. Now the new highs need to increase.
Q&A/Reader’s Feedback
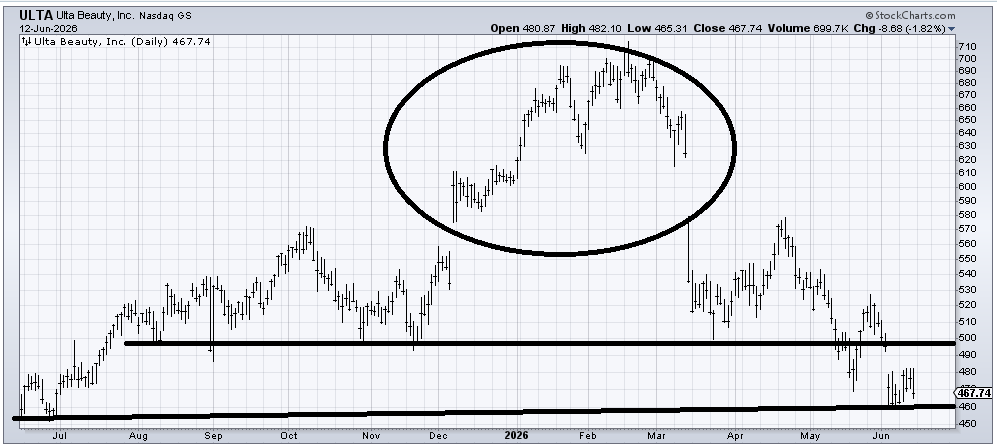
Ulta (ULTA) is probably oversold enough to bounce to fill that gap near 500, but that is the best I can say about it. When it gapped down in March, it left a big island up there (circle), which is not bullish. I would change my mind if it can gap up over 500 and leave the last two weeks of trading down here as an island.
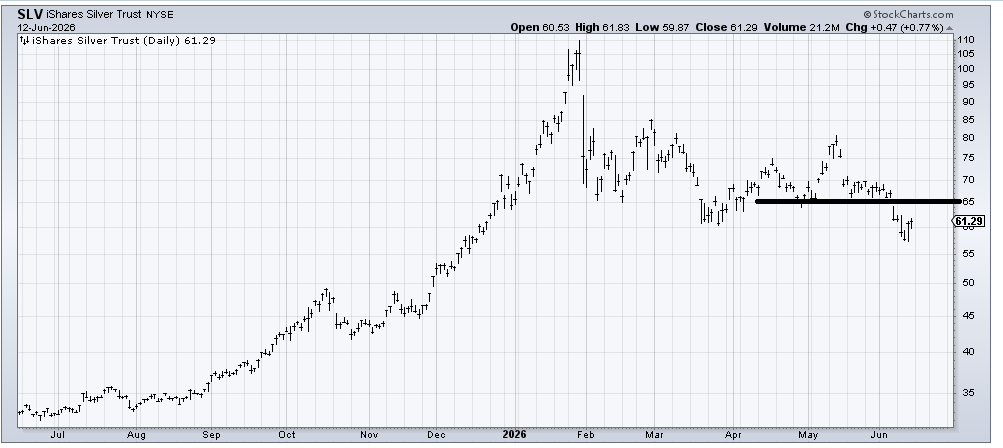
SLV, an ETF to be long Silver, is short-term oversold enough to rally to that 65-ish area. As a reminder, I think silver was a bubble that popped back in January. The best news is that it has fallen almost 50% already, but thus far, all I see is an oversold rally to resistance.
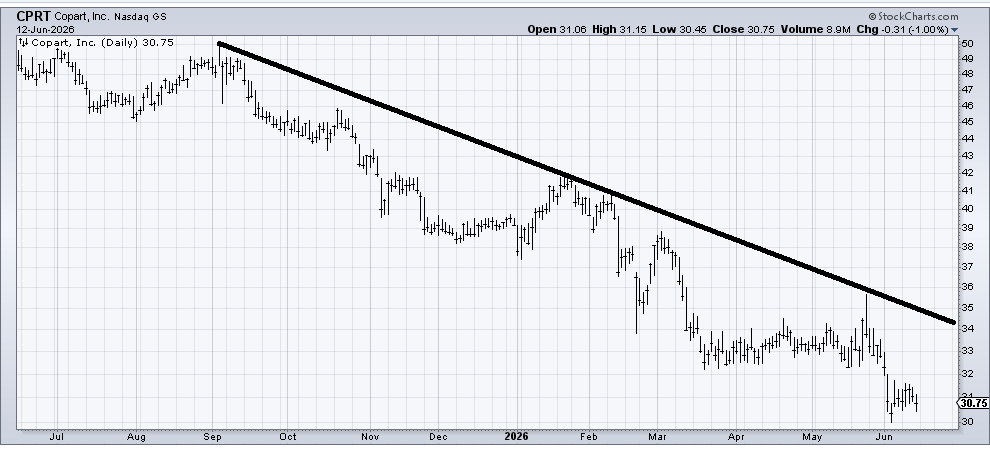
Copart (CPRT) is a stock in a downtrend, so unless/until it can make a higher high and/or cross that downtrend line, I would think any rally looks like an oversold rally in a downtrend.
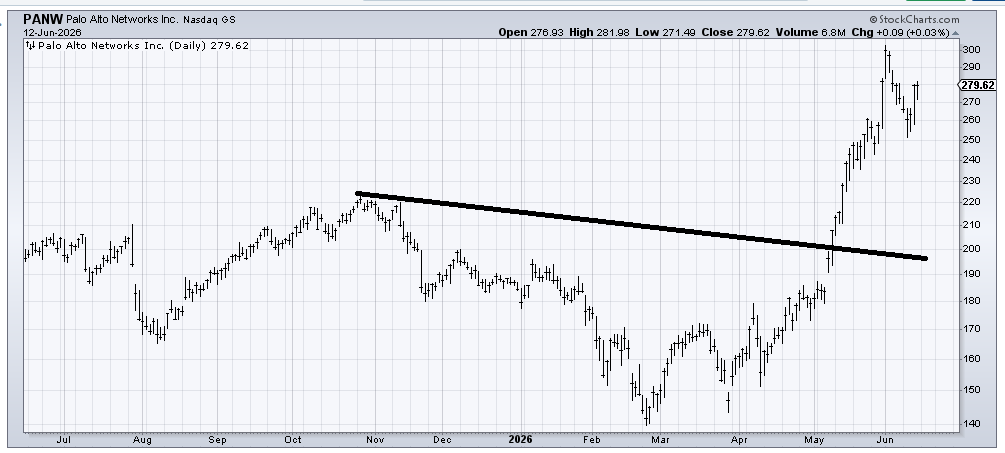
Palo Alto Networks (PANW) met its upside target when it tagged 300 recently. The chart hasn’t done anything wrong yet. I will consider it having done something wrong if it makes a lower high on this rebound and then makes a lower low. But it is not my cup of tea to buy it up here.
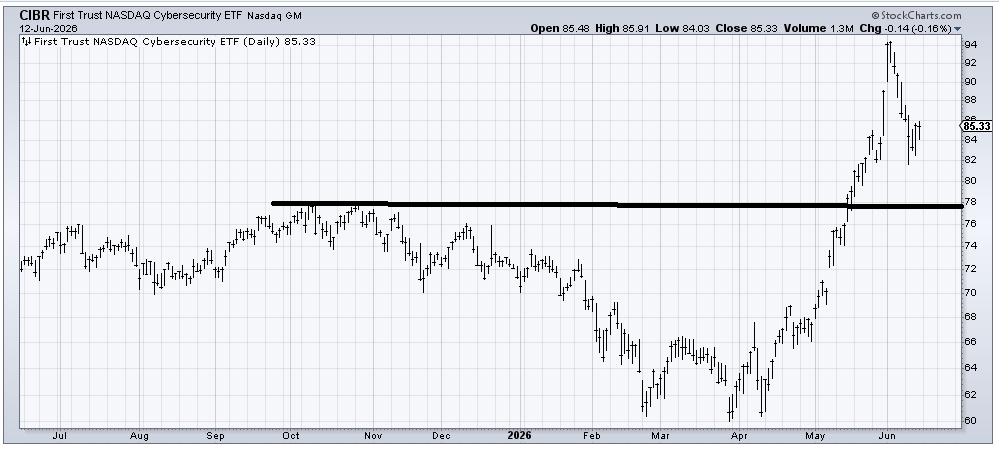
CIBR, an ETF to be long Cybersecurity stocks like PANW (above), is the same chart as PANW. Probably due for a bounce, but be on the alert for a lower high. If it is going to be the kind of chart I like, it will have to do some sideways work up here. You do not want to see it back under 82.
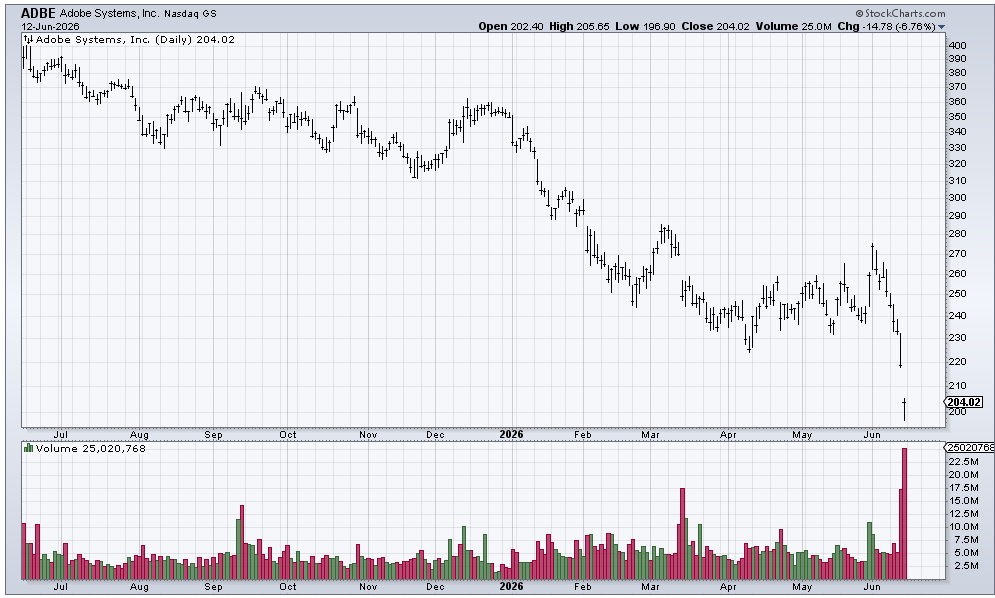
Adobe (ADBE) is the poster child for a former fan-fave tech stock that has fallen out of favor. I have tried, with very little success, to pick a bottom here in the last year (two years?). The best news I can offer is that the volume on Friday was extreme. If the stock can gap up over 210 and maintain it, thus leaving Friday as an island, that would be bullish.
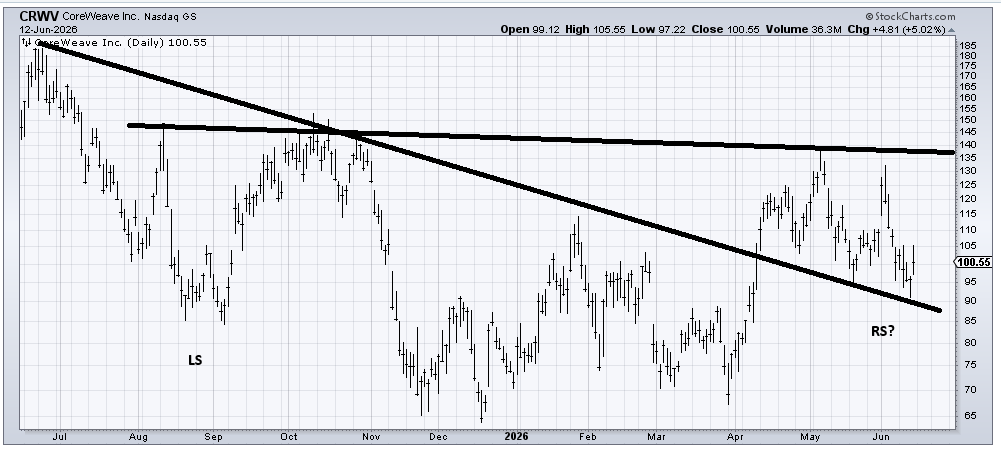
Is CoreWeave (CRWV) forming a head and shoulders bottom? There is much work to do before we can say so conclusively, but that’s the pattern I have in my head now. Short term, it is oversold, so let’s see if it can get back up to that early June high.
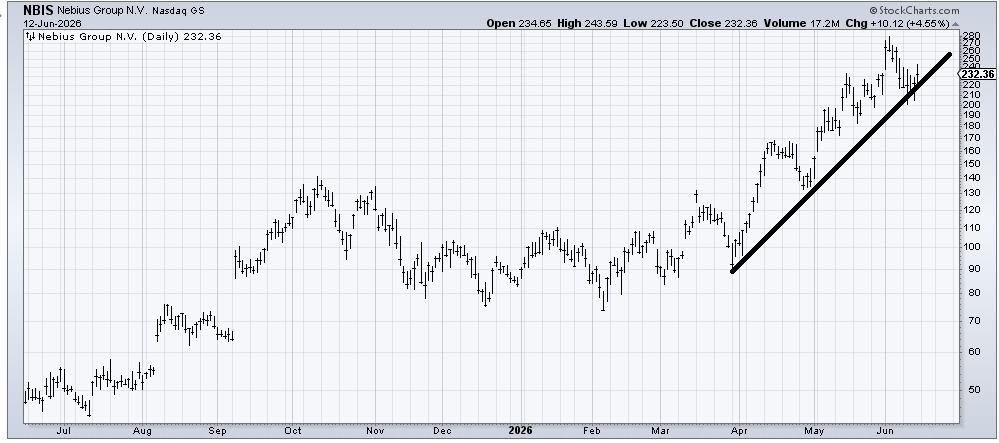
Nebius (NBIS) is not my kind of chart because I like them down and out, so I will just say as long as it stays over 200, it’s okay.