Five Below Could Get Even Cheaper
The retailer's stock tumbled after earnings and the charts say the declines may not be over.
You've reached your free article limit
You've read 0 of 1 free Pro articles.
Shares of Five Below FIVE tumbled Thursday after the company reported non-GAAP EPS of $0.60, which missed by $0.03, and revenue of $811.86M, which missed by $22.56M, as macro pressures on low-income customers clipped sales.
Let's check out the charts.
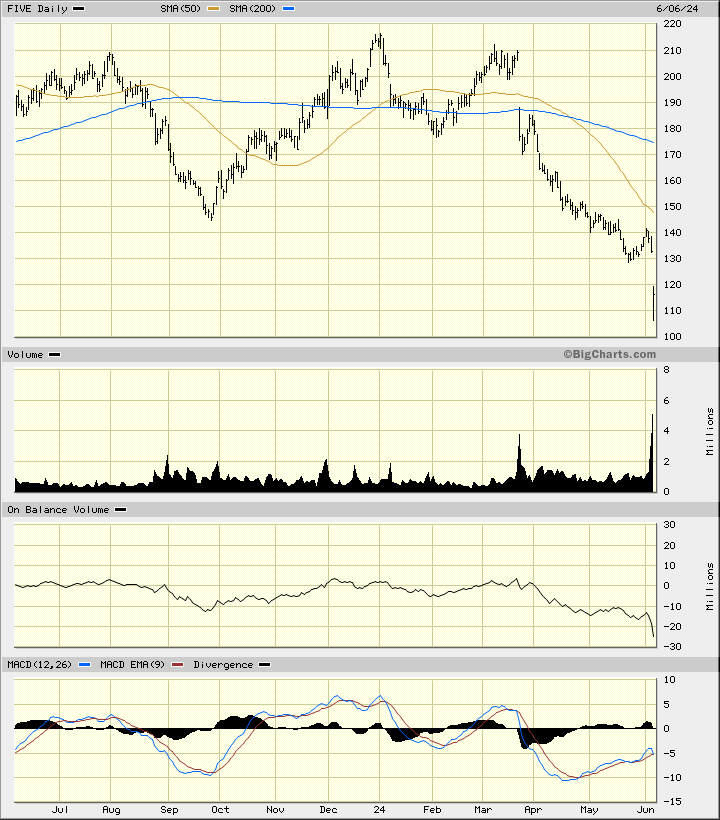
In the daily bar chart of FIVE, below, I can see that the shares gapped lower Thursday. Prices have been trading below the declining 50-day and 200-day moving averages for a while now.
Trading volume has increased since the middle of March and suggests to me that traders and investors are getting out. The On-Balance-Volume (OBV) line has declined to a new low for the move down to confirm the bearish trend.
The Moving Average Convergence Divergence (MACD) oscillator is below the zero line and likely to turn lower.
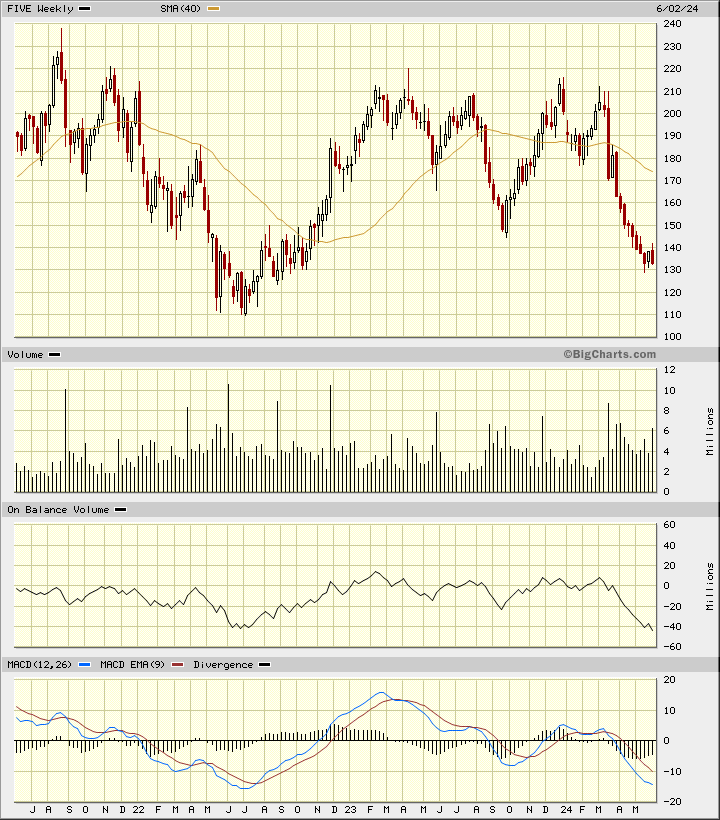
In the weekly Japanese candlestick chart of FIVE, below, we don't have Thursday's price action plotted but prices looked headed for a retest of the lows of 2022. The shares trade below the declining 40-week moving average line.
The On-Balance-Volume (OBV) line is pointed down and confirms the price weakness. The MACD oscillator is bearish.
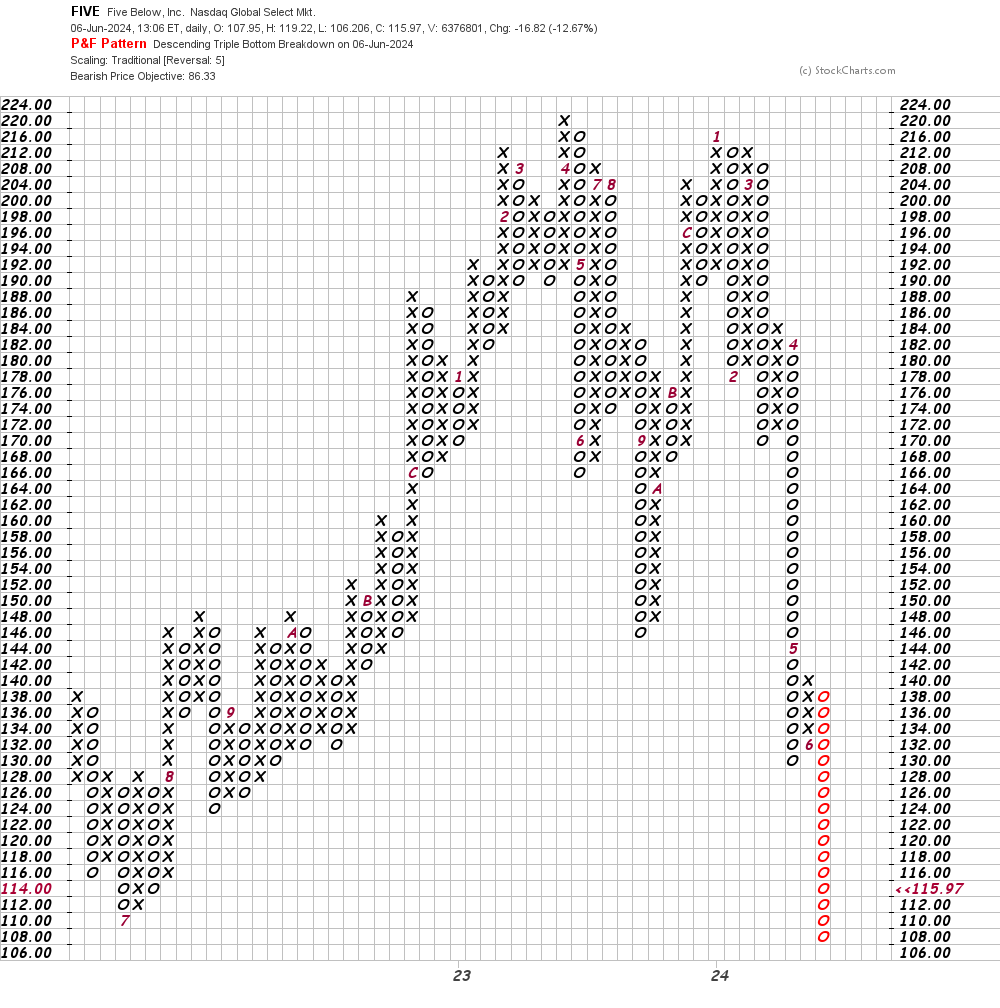
In this daily Point and Figure chart of FIVE, below, I can see a price target in the $86 area using a five box reversal filter.
In this weekly Point and Figure chart of FIVE, below, I used a five-box reversal filter. Here the software suggests a price target in the $86 area.
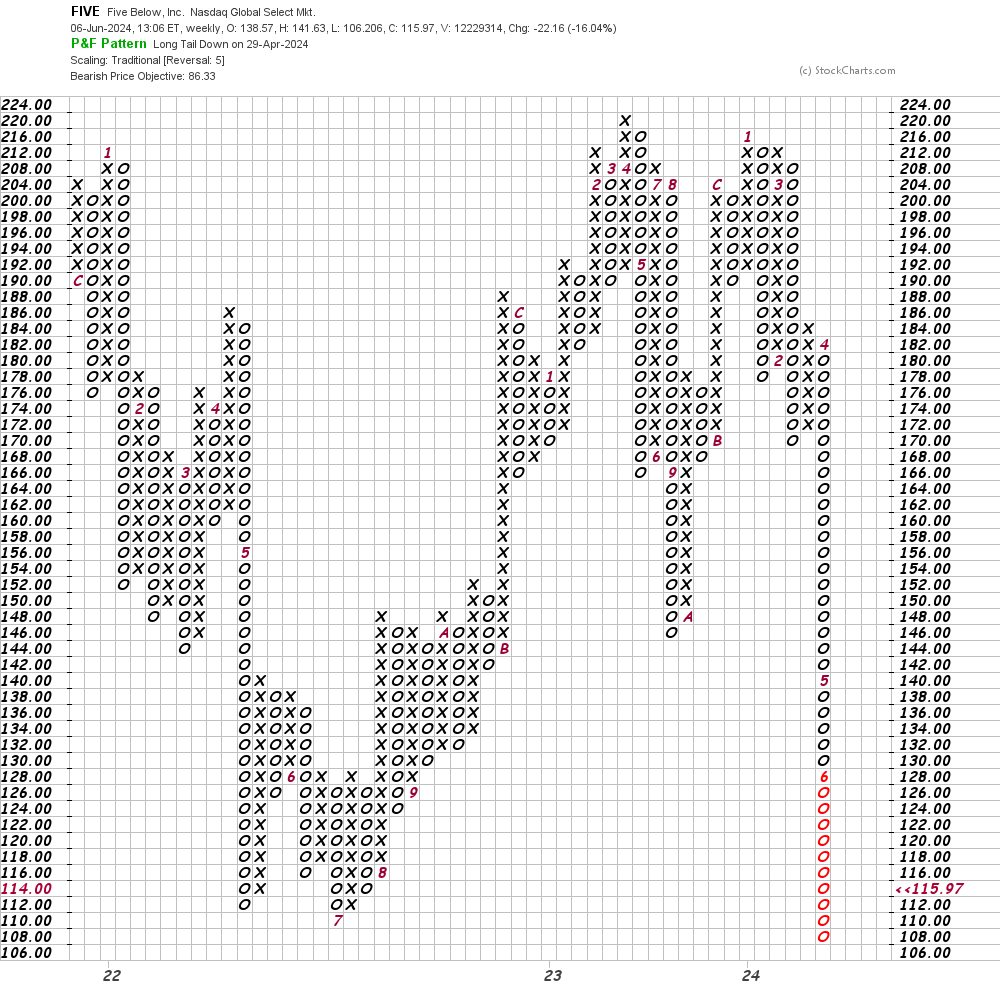
Bottom-line strategy: Shares of FIVE could bounce but the charts and indicators suggest that further declines are possible.
Employees of TheStreet are prohibited from trading individual securities.