This Energy Stock Has Potential for a Big Upside Move
Here's what to know as trading volume suggests we are seeing increased investor interest.
You've reached your free article limit
You've read 0 of 1 free Pro articles.
Houston, Texas-based Cheniere Energy LNG is engaged in businesses related to liquefied natural gas (or LNG) through its two business segments: LNG terminal; and LNG and natural gas marketing.
The charts and indicators of the stock LNG suggest a big upside move is possible in the months ahead.
Let's drill down into the charts.
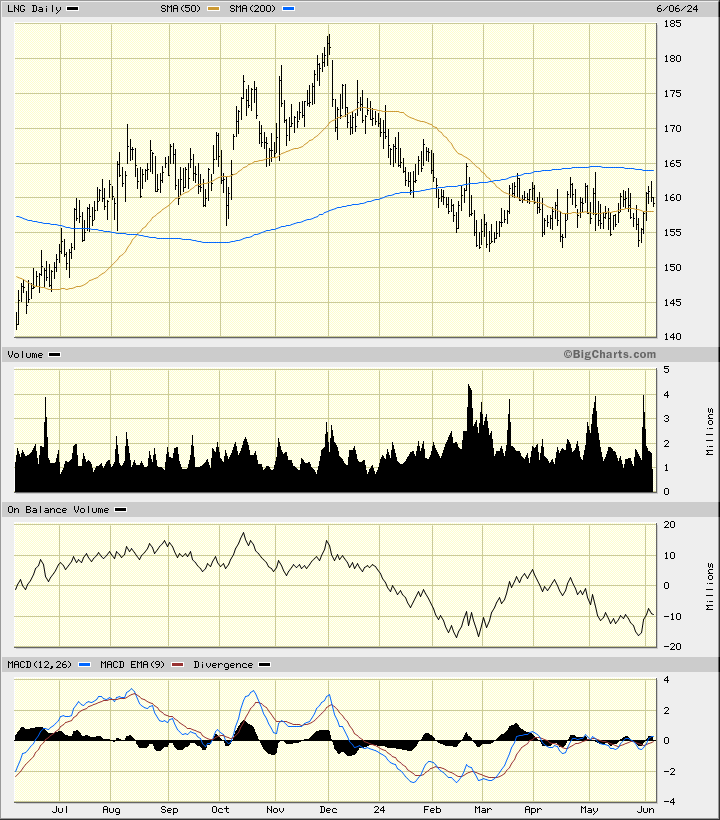
In the daily bar chart of LNG, below, I see a lot of choppy sideways price action the past year. The shares have traded around the 50-day and the 200-day moving average lines.
The trading volume looks to be more active since late February and suggests we are seeing increased investor interest. The daily On-Balance-Volume (OBV) line made a low in late February and another low in late May. The Moving Average Convergence Divergence (MACD) oscillator has fluctuated around the zero line.
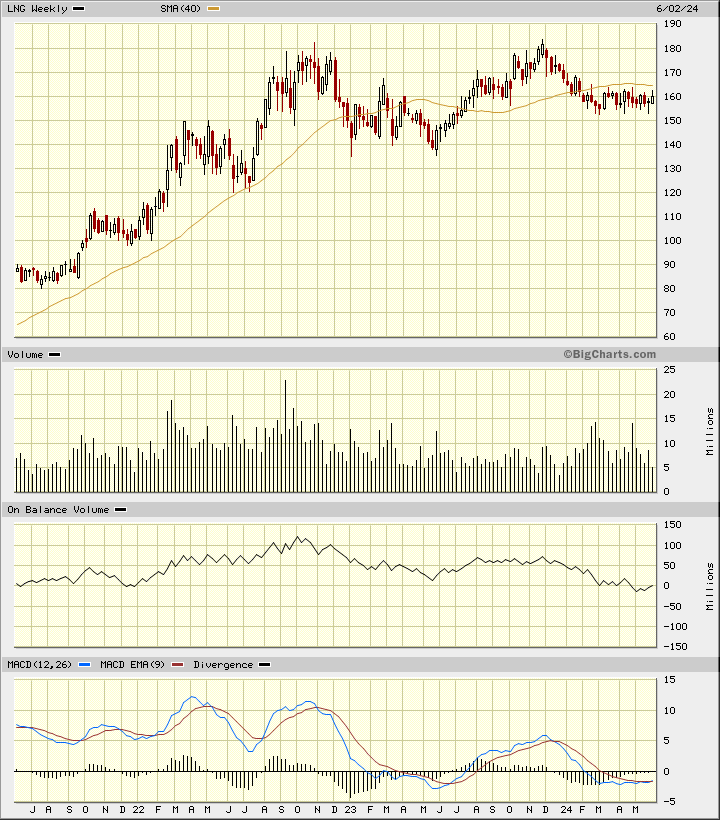
In the weekly Japanese candlestick chart of LNG, below, I can see two clear trends. The first trend was an uptrend where prices more than doubled. The second trend is a sideways or neutral trend and prices are getting closer to their apex. LNG trades below the 40-week moving average line but that could change with just a modest rally.
The weekly OBV line has been weak since October 2022 but a low may have been reached in recent weeks. The MACD oscillator is below the zero line but poised for a potential upside crossover and cover shorts buy signal.
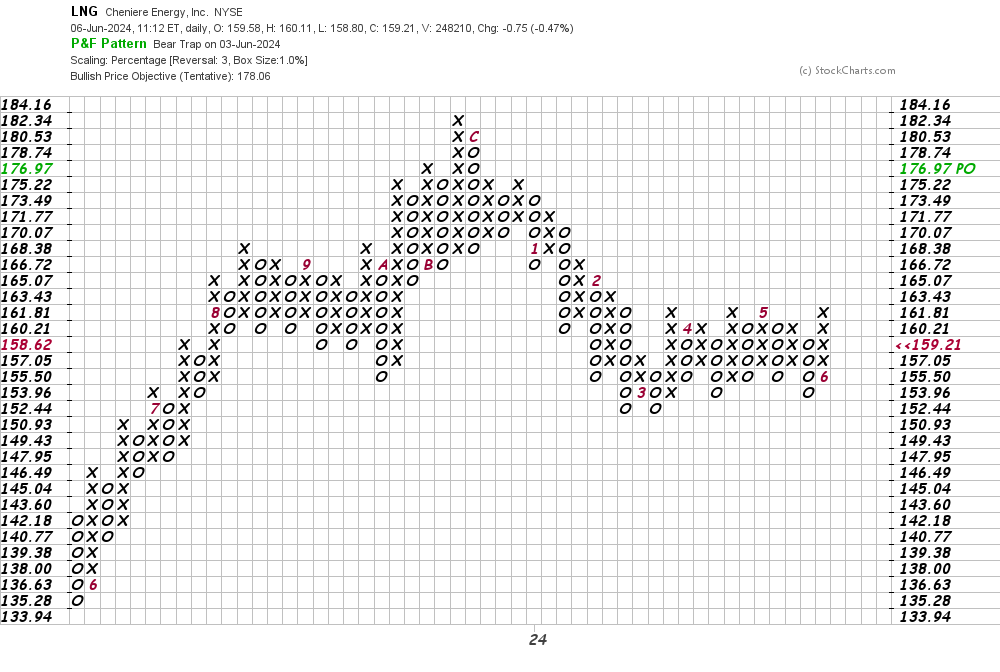
In this daily Point and Figure chart of LNG, below, I can see an upside price target in the $178 area.
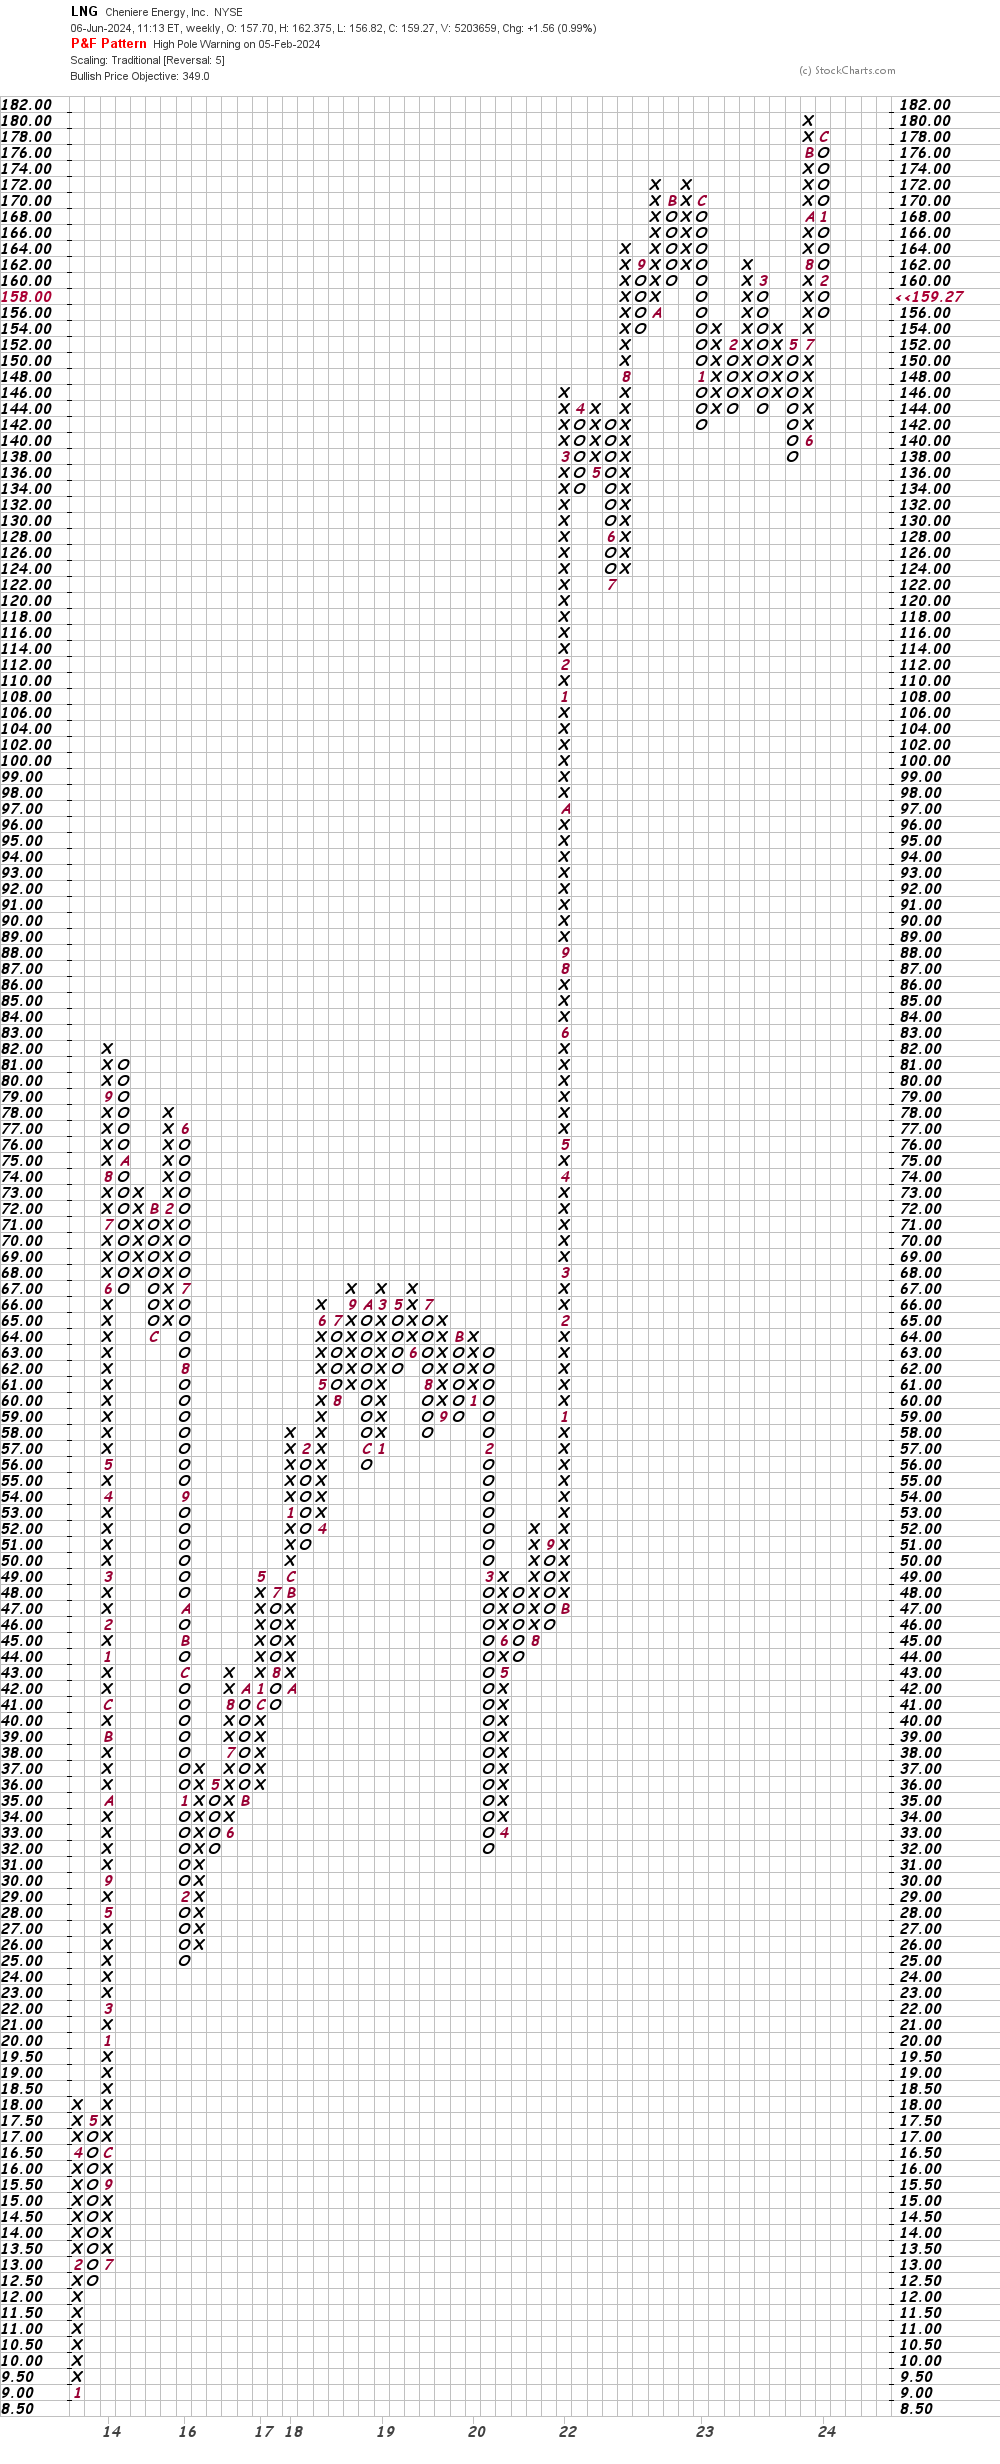
In this second Point and Figure chart of LNG, below, I used weekly price data with a five-box reversal filter. Here the software suggests a price target in the $349 area. Wow.
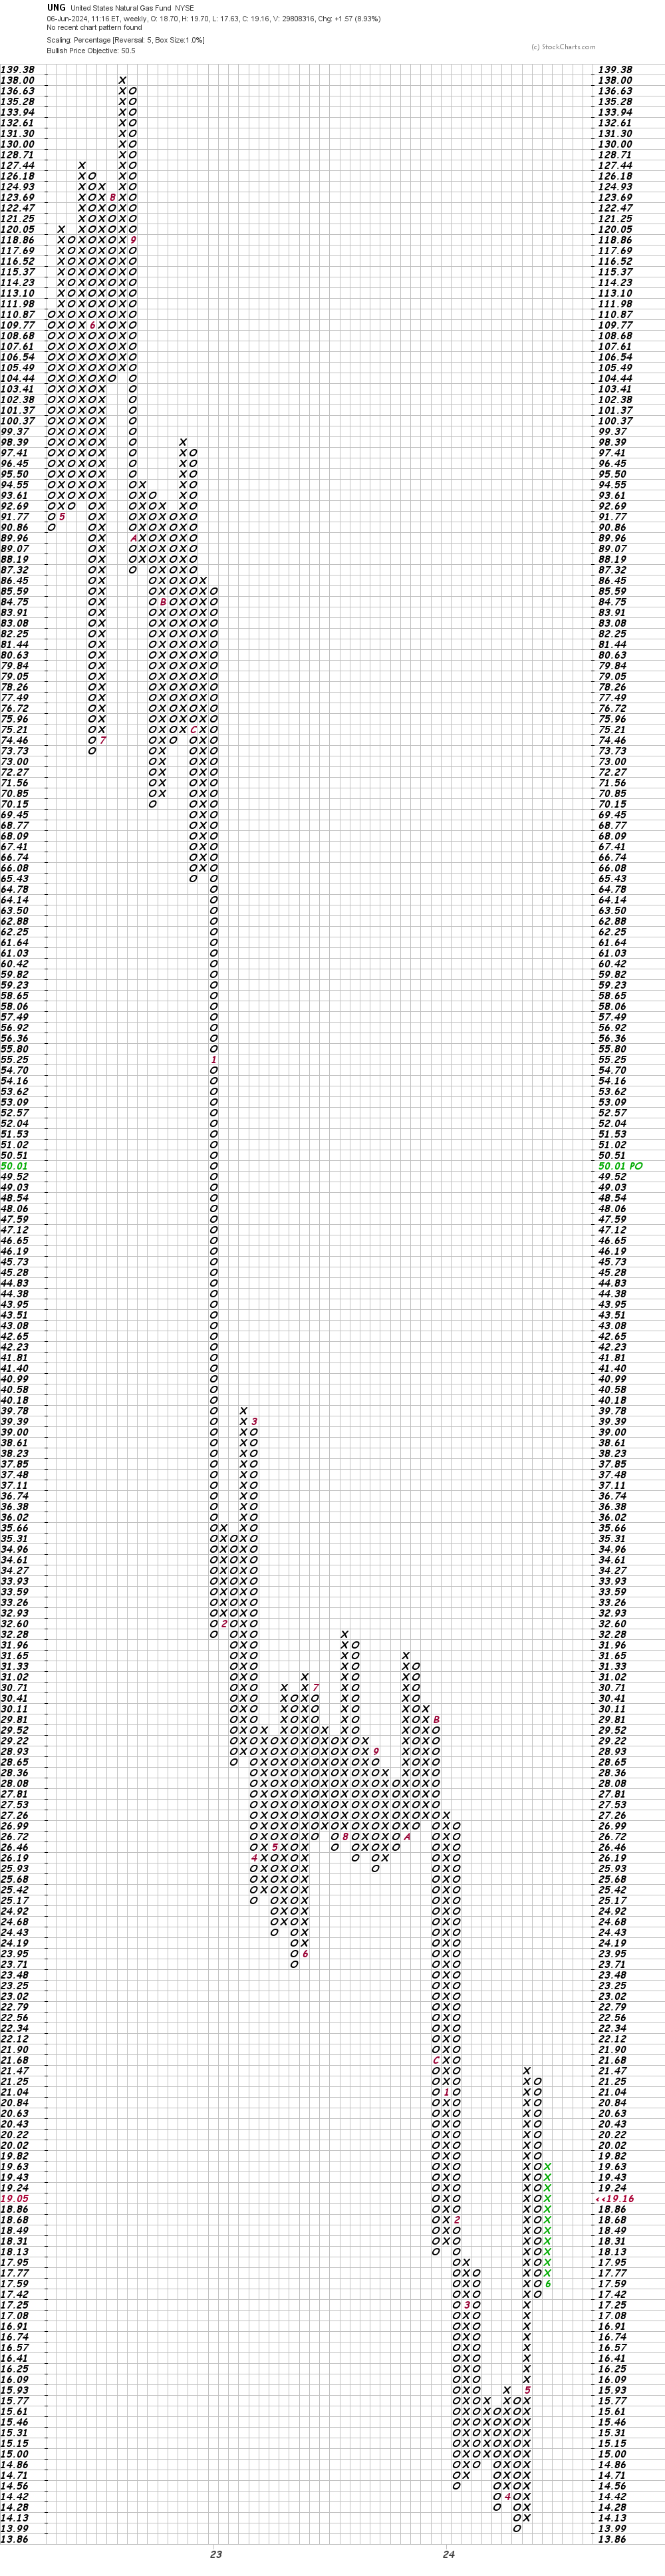
In this Point and Figure chart of the UNG — the natural gas ETF — below, I can see a price target in the $51 area. Maybe.
Bottom-line strategy: Energy bulls have been disappointed a number of times over the past two years but I am optimistic about the future. Traders should keep their powder dry and wait for two closes above $165 before going long LNG. Patience.
Employees of TheStreet are prohibited from trading individual securities.