Energy Charts Offer Insight on Tenuous U.S – Iran Peace Deal
We’re getting a clear signal from the charts about how the market views the latest from the Middle East.
You've reached your free article limit
You've read 0 of 1 free Pro articles.

We’ve been told repeatedly that this war is over, but when it comes to peace in the Middle East, complications always seem to arise.
This time could be different. A framework for a peace deal has been signed by President Trump, Vice President Vance and Iranian Parliament Speaker Ghalibaf.
It’s difficult to assess the potential reactions to this deal. Unexpected disruptions or delays could arise from Israel, Hezbollah, Lebanon, the Houthis, or from several factions within Iran itself.
Charts Tell the Story
Despite potential disruptions, we’re getting a clear signal from the charts that the end of this conflict is drawing near, and that energy prices are headed even lower.
On Monday, West Texas Intermediate crude oil touched its lowest level in two months, and closed at its lowest price in three months. A large rounded top has formed (shaded yellow), indicating that the path of least resistance for crude oil prices leads lower.
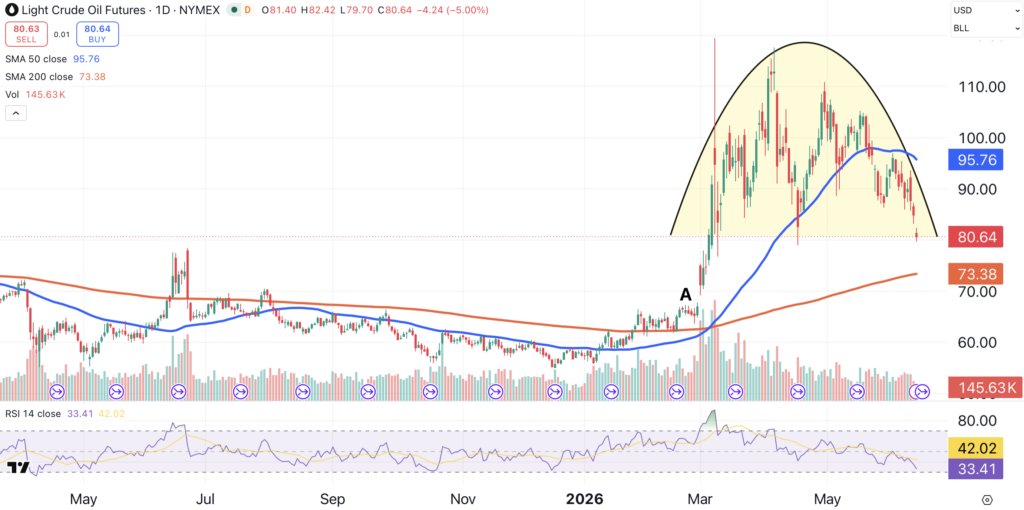
Based on this chart, a return to $67 —and possibly lower — for WTI crude is on the cards.
The Epic Fury Effect
WTI crude needs to fall to $67 to fill a gap that occurred on March 2 (point A). That was the day the U.S. launched Operation Epic Fury, striking thousands of targets across Iran.
The size of the rounded top suggests a greater decline, but I believe that’s unlikely in the near term. Still, a move to $67 would be great news for consumers and businesses alike.
WTI crude oil’s 50-day moving average (blue) is now declining, another bearish sign.
Confirmation From RBOB
Reformulated blendstock for oxygenated blending (RBOB) is an unfinished petroleum product that is the basis for the gasoline used to fuel automobiles. On Monday, cash RBOB touched $2.95, its lowest level since April 17.
Like WTI crude, the RBOB chart also appears to have formed a topping pattern. In this case, that pattern resembles an incomplete and uneven head and shoulders. (shaded yellow).
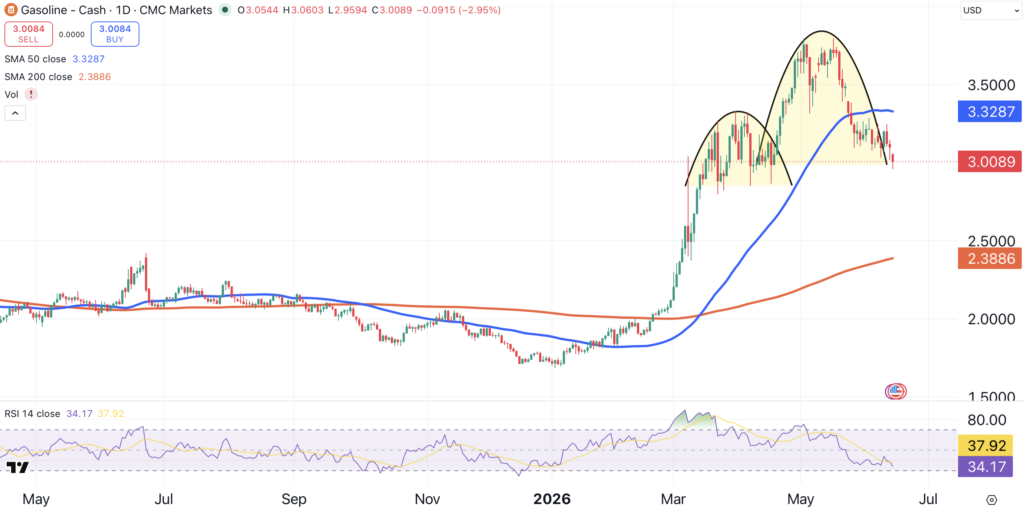
Based on this chart, RBOB could eventually work its way down to $2.25.
The Inflation Factor
The most recent figures show consumer inflation (CPI) rising at a 4.2% annual rate, while prices are rising at a 6.5% annual rate at the producer level (PPI). However, if we remove food and energy prices, core CPI is rising at 2.9%, while core PPI is climbing at 4.9%.
While an improvement over headline inflation, the core figures are still much too high. The continued drop in energy prices should have a major impact on the headline numbers, but less so on the core figures.
Bottom Line
We expect the decline in energy prices to continue for some time. Because of this, we’re closing our only energy-related long position, EOG Resources (EOG), at a small loss.
Headline inflation figures should come off their highs over the next few months, but will likely remain well above the Fed’s stated target of 2% for both CPI and PPI. This applies to both headline and core figures. When that happens, perhaps the Fed will realize that it has once again fallen behind the curve on inflation.
At the time of publication, Ponsi had no positions in any securities mentioned.
