A Legendary E-Commerce Brand Might Be Back
One of the first online retailers is flashing some positive price data with a new upside price target coming into view.
You've reached your free article limit
You've read 0 of 1 free Pro articles.
Remember eBay EBAY, the online commerce platform? Yeah, that eBay. The charts now look pretty positive, so let's check it out.
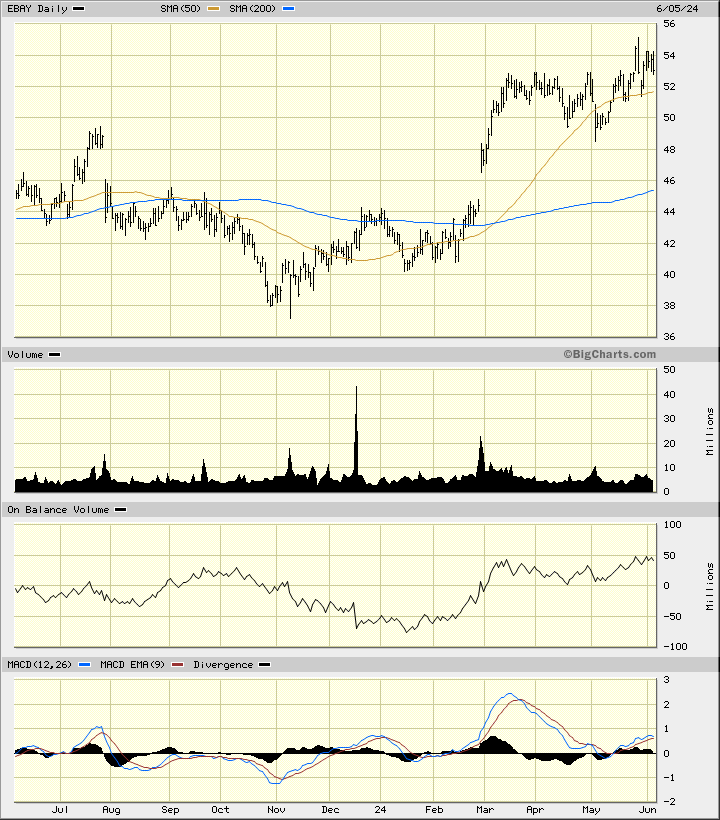
In this daily bar chart of EBAY below, I see a positive picture. Prices are in an upward trend and trade above the rising 50-day moving average line and above the bullish 200-day moving average line. The On-Balance-Volume (OBV) line shows us strength since January. The Moving Average Convergence Divergence (MACD) oscillator is above the zero line in positive territory.
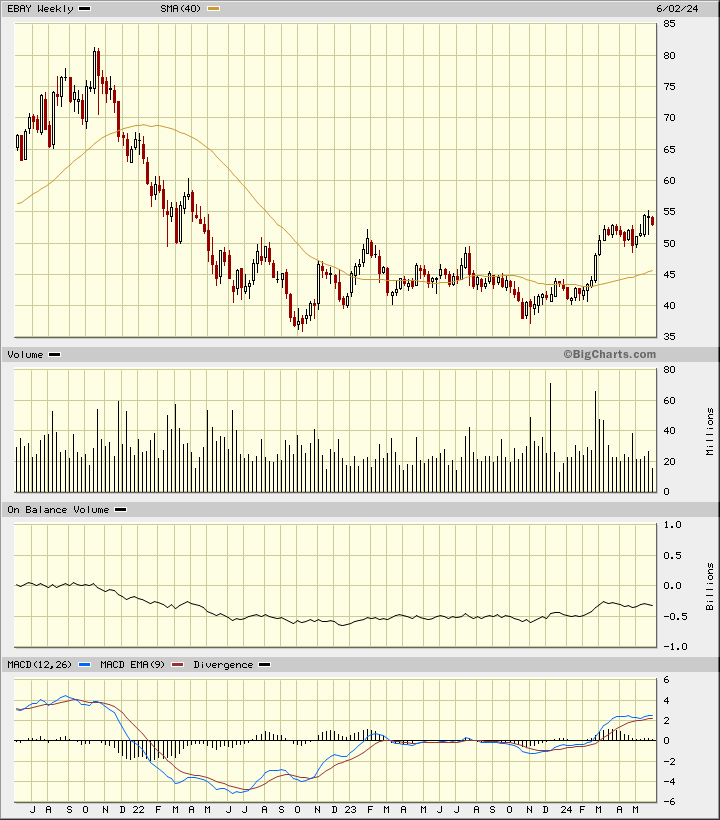
In this weekly Japanese candlestick chart of EBAY below, you can see a bottom pattern. Buyers have been active the past two years whenever EBAY got into the $40 to $35 area. Prices trade above the rising 40-week moving average line, so math tells us we are in an uptrend. The weekly OBV line has followed and confirmed the price action. The MACD oscillator has been in a buy signal (above the zero line) since March.
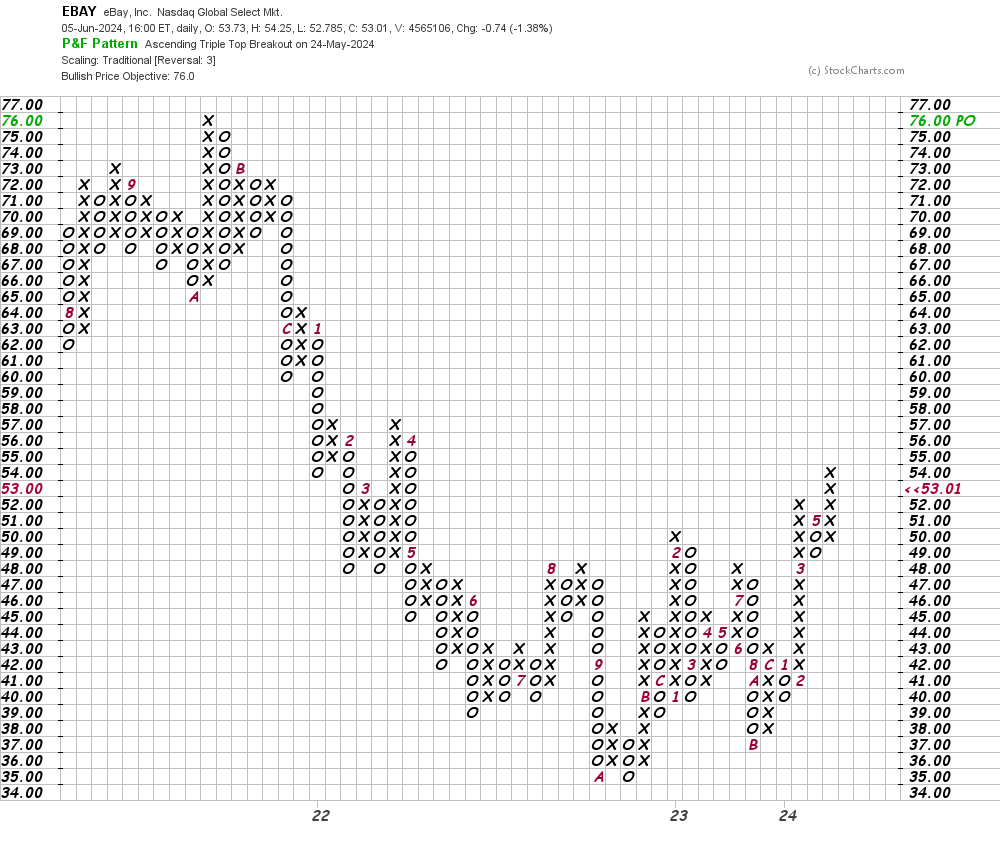
In this daily Point and Figure chart of EBAY below, I can see the base pattern and the software has generated an upside price target in the $76 area.
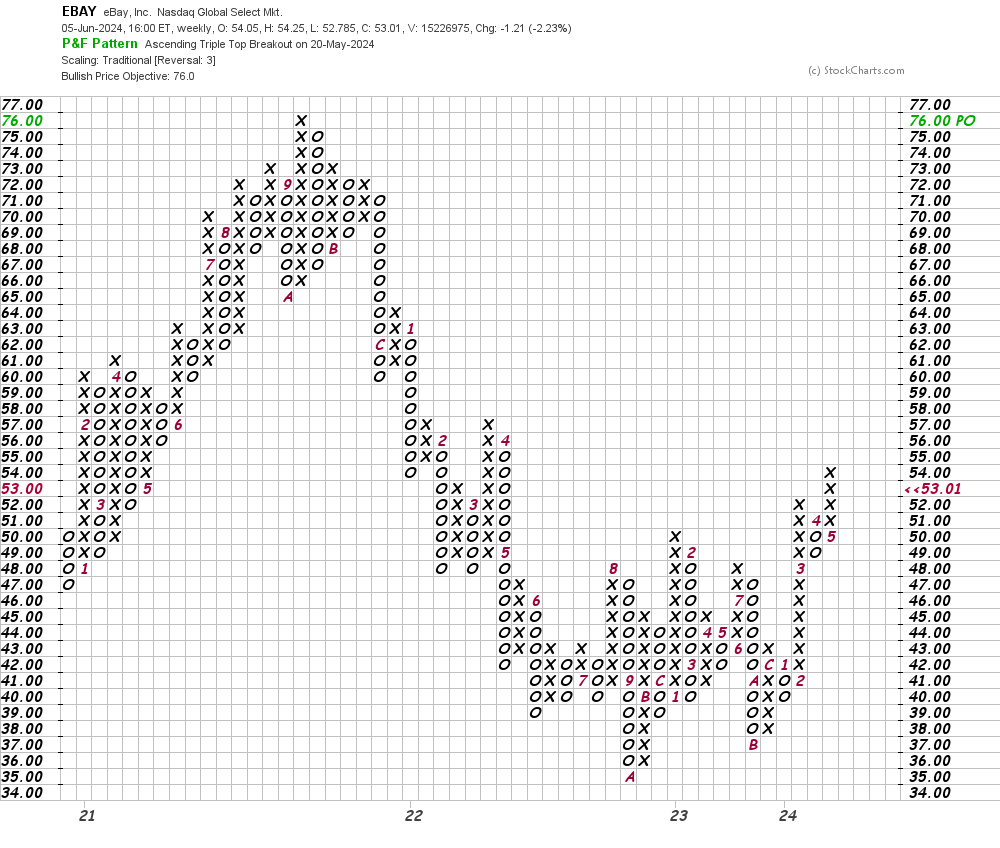
In this weekly Point and Figure chart of EBAY, I can see the same bottom and the same target as the daily chart above.
Bottom line strategy: Traders could go long EBAY on a dip towards $52 risking to $49. The $76 area is my Point and Figure price target.
Employees of TheStreet are prohibited from trading individual securities.