Does the Infosys Stock Rally Have More in the Tank?
The shares have climbed rapidly the past two months. Here's what could be next.
You've reached your free article limit
You've read 0 of 1 free Pro articles.
Infosys Ltd. INFY is an India-based leader in "next-generation digital services and consulting." The ADRs have made a strong advance over the past two months so it is natural to ask whether this can continue or is a pullback likely.
Let's check out the charts and indicators for the answer.
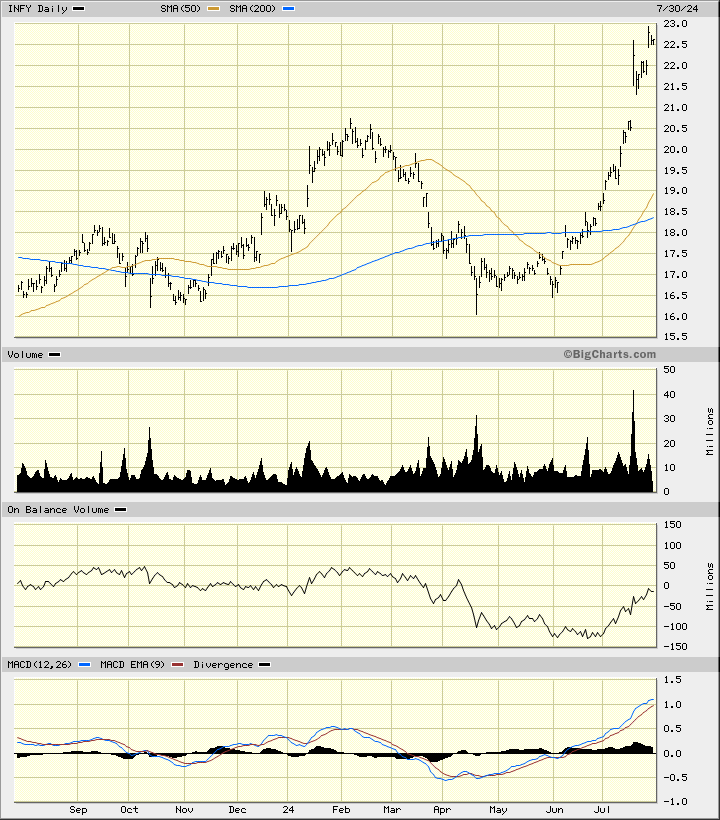
In the daily bar chart of INFY, below, I can see that the shares have climbed rapidly higher the past two months. INFY trades above the rising 50-day moving average line which has recently crossed above the 200-day moving average line for a bullish golden cross.
The On-Balance-Volume (OBV) line declined into late June and then turned higher in July. The Moving Average Convergence Divergence (MACD) oscillator is in a bullish alignment above the zero line.
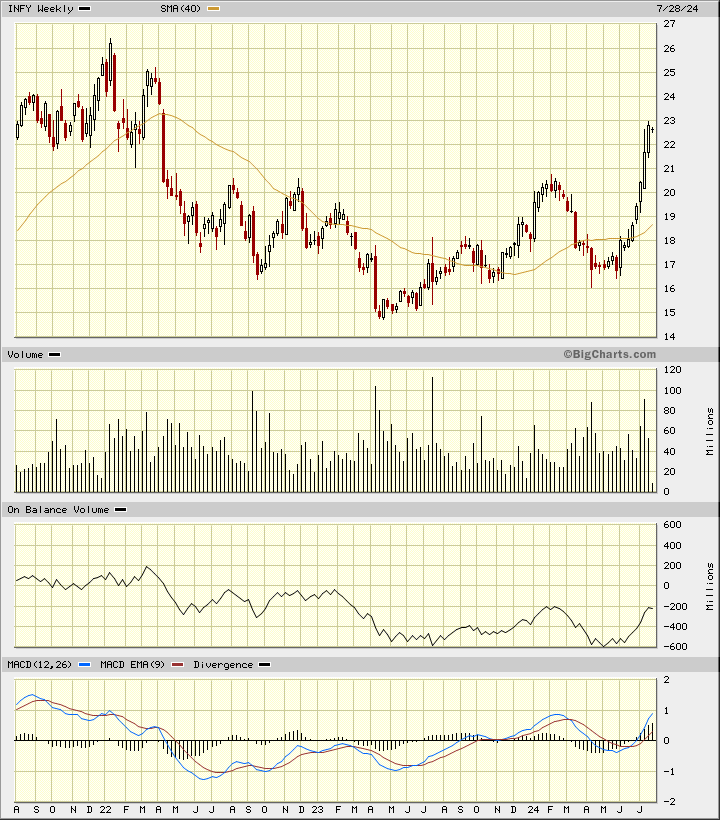
In the weekly Japanese candlestick chart of INFY, below, I can see a pretty strong picture. INFY trades above the rising 40-week moving average line.
The weekly OBV line has moved in step with the price action. The MACD oscillator is in a bullish move above the zero line. The latest candle pattern is a doji and could become part of a top reversal pattern.
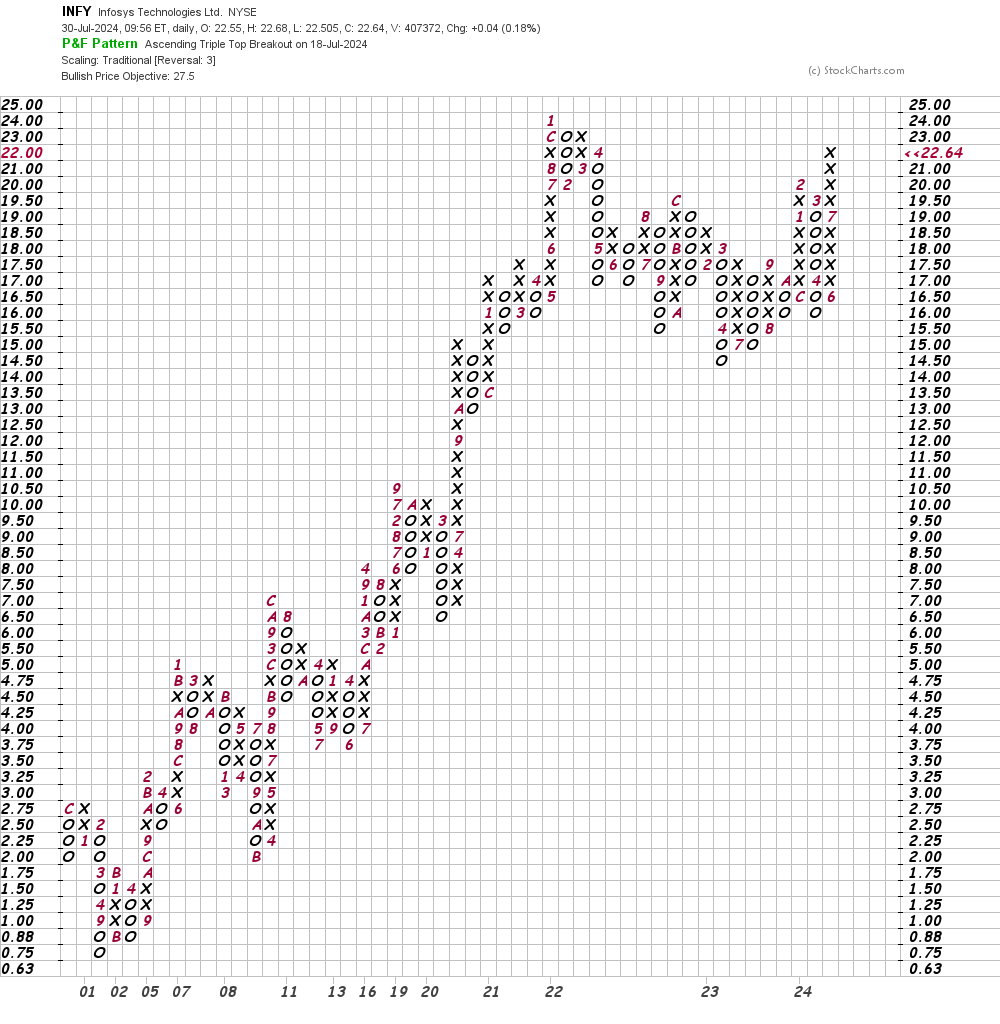
In this daily Point and Figure chart of INFY, below, I can see a potential upside price target in the $28 area.
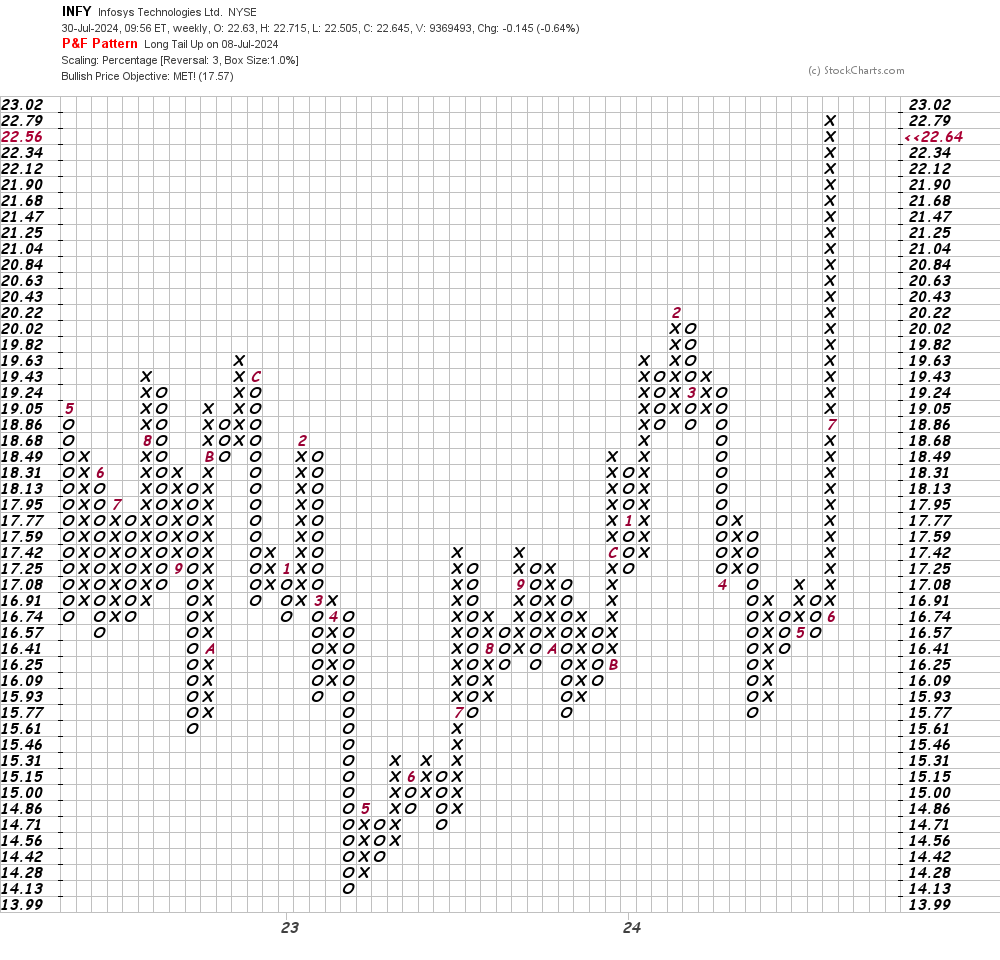
In this weekly Point and Figure chart of INFY, below, I can see that prices reached and exceeded a price target in the $18 area.
Bottom-line strategy: INFY has made a strong advance and looks poised for a pause and maybe even a correction. The stock made two upside gaps in July and it would not surprise me that one or even two of these gaps are filled.
Employees of TheStreet are prohibited from trading individual securities.