Disney Likely to See Further Declines Ahead
The mass media giant appears to be in a downtrend with further losses to come.
You've reached your free article limit
You've read 0 of 1 free Pro articles.
I looked at shares of Walt Disney DIS back on May 30, 2024 and wrote that, "The share price of DIS could hold and rally off the rising 200-day moving average line but there is a risk we see further declines towards a Point and Figure target in the $81 area."
Let's check out the charts again. Maybe it is the time for a cruise, or maybe not.
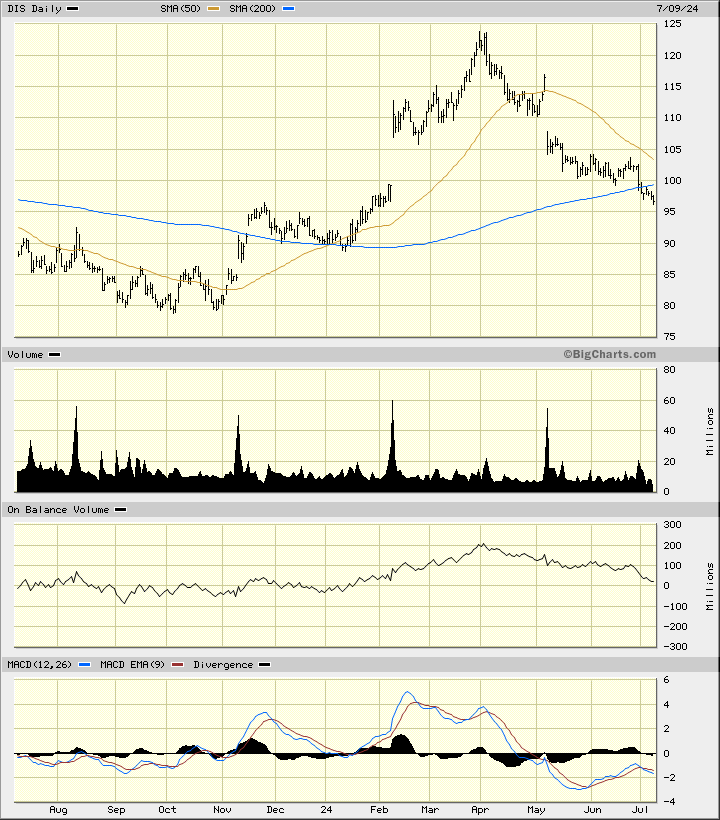
In this daily bar chart of DIS below, I can see that prices have continued to weaken since late May. Prices now trade below the 200-day moving average line and below the declining 50-day moving average line. The On-Balance-Volume (OBV) line has weakened for more than three months now. The Moving Average Convergence Divergence (MACD) turned bearish in late April.
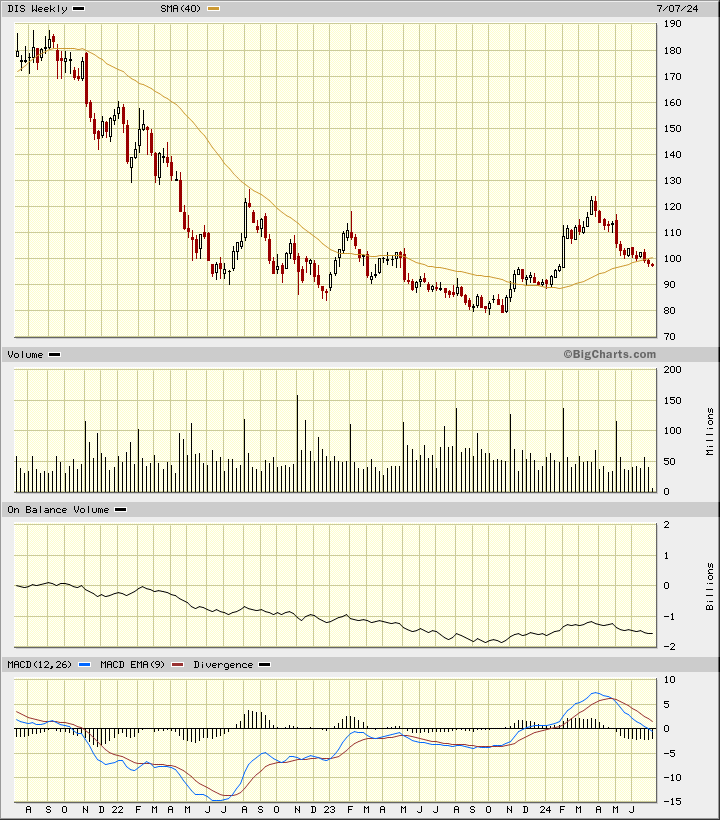
In this weekly Japanese candlestick chart of DIS below, I can see that prices are trading below the 40-week moving average line. The weekly OBV line is pointed down and the MACD oscillator is nearly back to the zero line.
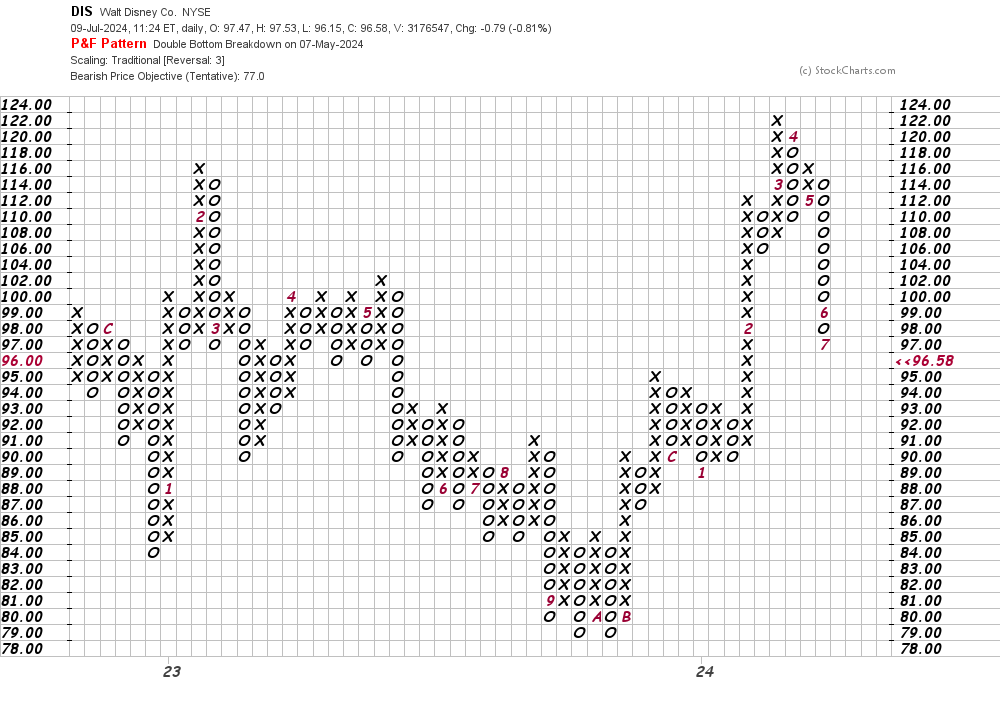
In this daily Point and Figure chart of DIS below, I can see a downside price target in the $77 area.
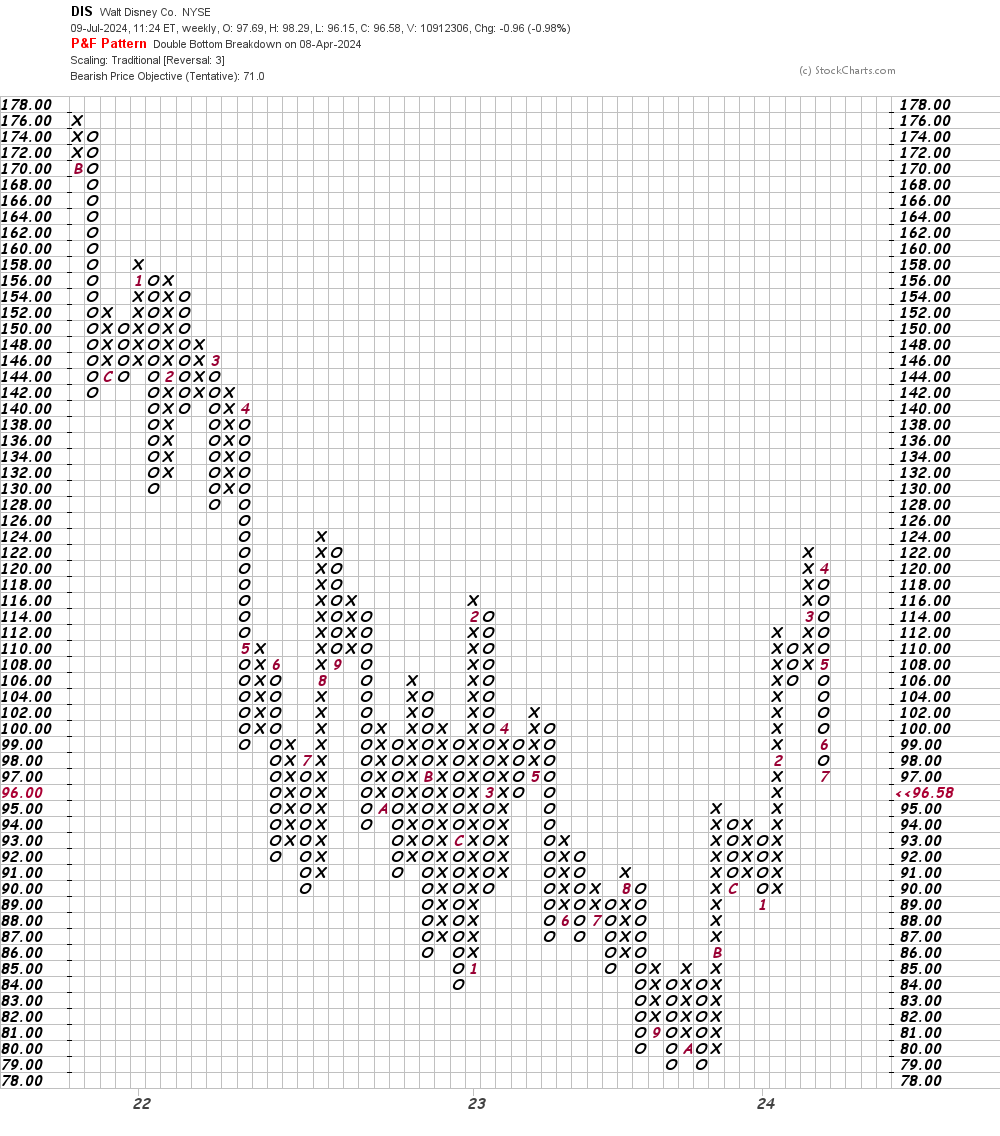
In this weekly Point and Figure chart of DIS below, I can see a $71 price target.
Bottom line strategy: Shares of DIS could bounce as they are oversold based on overbought/oversold indicators, but the trend is still down and further declines are likely.
Employees of TheStreet are prohibited from trading individual securities.