As Nelson Peltz Checks Out of Disney, What Are the Charts Telling Investors?
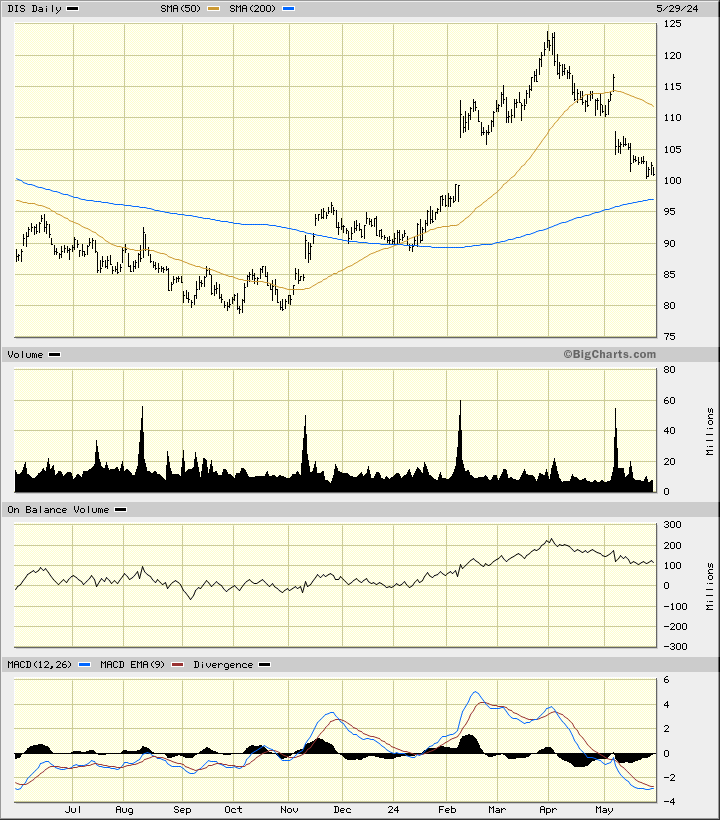
Shares are trading below the declining 50-day moving average line and are close to a test of the rising 200-day moving average line.
You've reached your free article limit
You've read 0 of 1 free Pro articles.
Reports Thursday morning say that activist investor Nelson Peltz sold his entire stock position in Walt Disney DIS. Peltz heads up the hedge fund Trian Fund Management and supposedly controlled about $3.5 billion in Disney stock along with the reclusive Ike Perlmutter.
Let's check out the charts and indicators of Disney.
In this daily bar chart of DIS, below, I can see that the shares made a high in early April and subsequently started a decline. The shares are now trading below the declining 50-day moving average line and are now close to a test of the rising 200-day moving average line.
The On-Balance-Volume (OBV) line made a high as prices made a high in early April. The OBV line has been weak for the past two months telling me that sellers of DIS have been more aggressive than buyers. The Moving Average Convergence Divergence (MACD) oscillator is in a bearish alignment below the zero line.
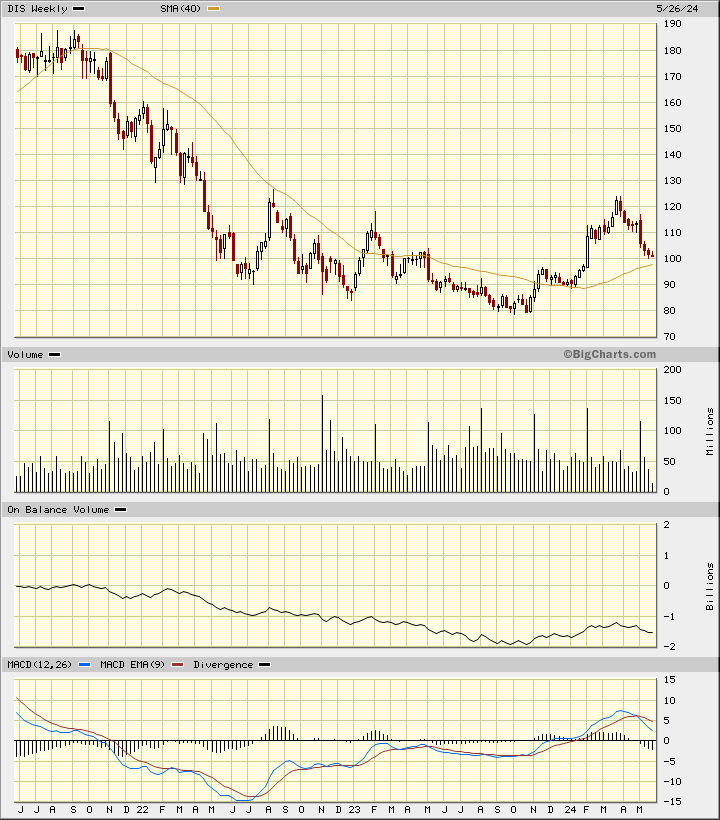
In this weekly Japanese candlestick chart of DIS, below, I can see that share prices are retreating back into a potential base pattern. Prices are close to a test of the rising 40-week moving average line.
The weekly OBV line turned lower in late March. The MACD oscillator has crossed to the downside for a take profit sell signal.
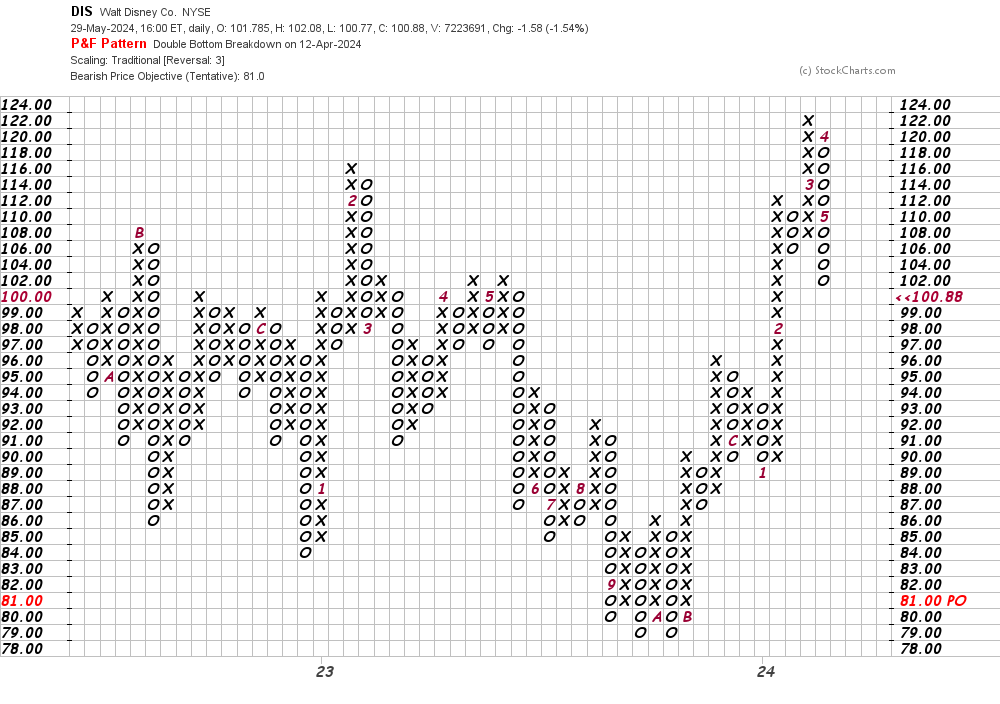
In this daily Point and Figure chart of DIS, below, I can see a potential downside price target in the $81 area.
In this weekly Point and Figure chart of DIS, below, I see that the software is projecting a target in the $81 area.
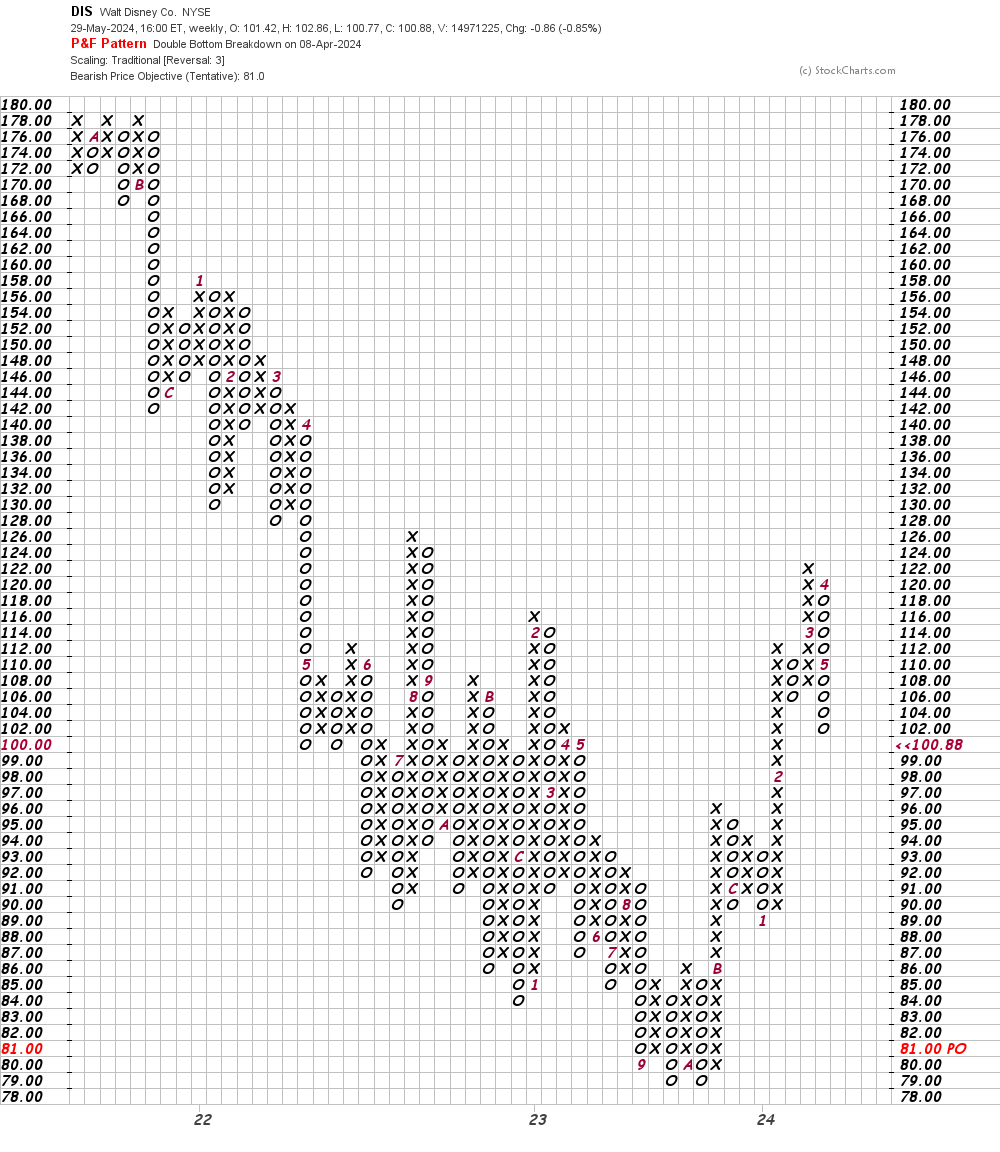
Bottom-line strategy: The share price of DIS could hold and rally off the rising 200-day moving average line but there is a risk we see further declines towards a Point and Figure target in the $81 area.
Employees of TheStreet are prohibited from trading individual securities.