Delta Air Lines Charts Are Up, Up and Away
Here's how to trade the stock.
You've reached your free article limit
You've read 0 of 1 free Pro articles.
Delta Air Lines DAL reported record Q1 earnings Wednesday morning. Earnings and forward guidance were better than anticipated. Good numbers just as the peak travel season approaches. The stock price has rallied but the broad market averages are having a turbulent start to the day in reaction to a hotter than expected inflation report.
Let's check out the charts of DAL and see what sort of flight plan we need to file.
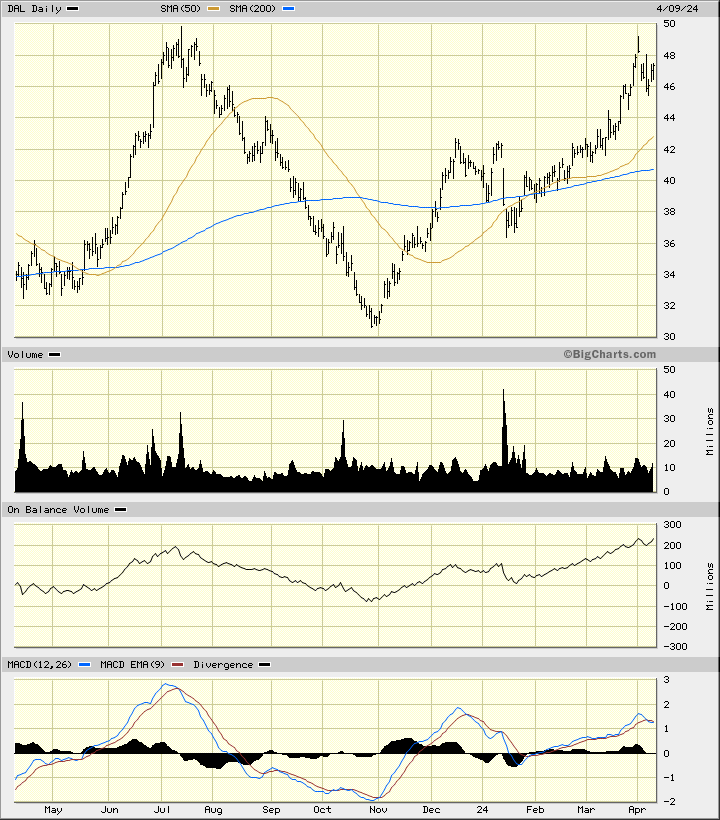
In this daily bar chart of DAL, below, I can see that prices have rallied sharply after making a "V" bottom in October. DAL is now trading above the rising 50-day and rising 200-day moving average lines.
The On-Balance-Volume (OBV) line has shown good strength since late October and tells me that buyers of DAL have been more aggressive than sellers. The Moving Average Convergence Divergence (MACD) oscillator is above the zero line but struggling to keep rising.
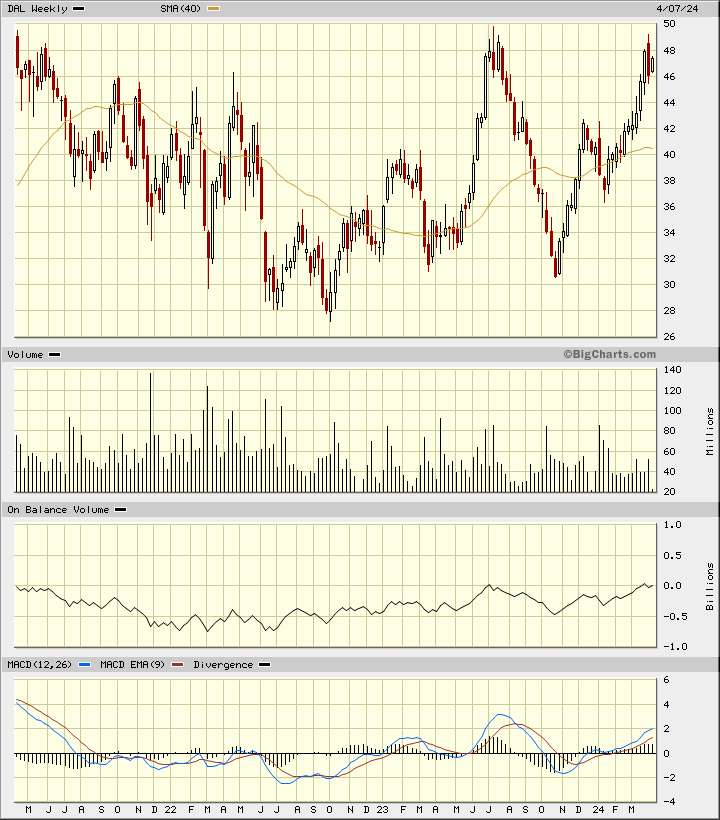
In this weekly Japanese candlestick chart of DAL, below, I can see a constructive picture. Prices are in an uptrend and trade above the rising 40-week moving average line.
The weekly OBV line shows a number of up and down moves within a general rising pattern the past two years. The MACD oscillator is above the zero line.
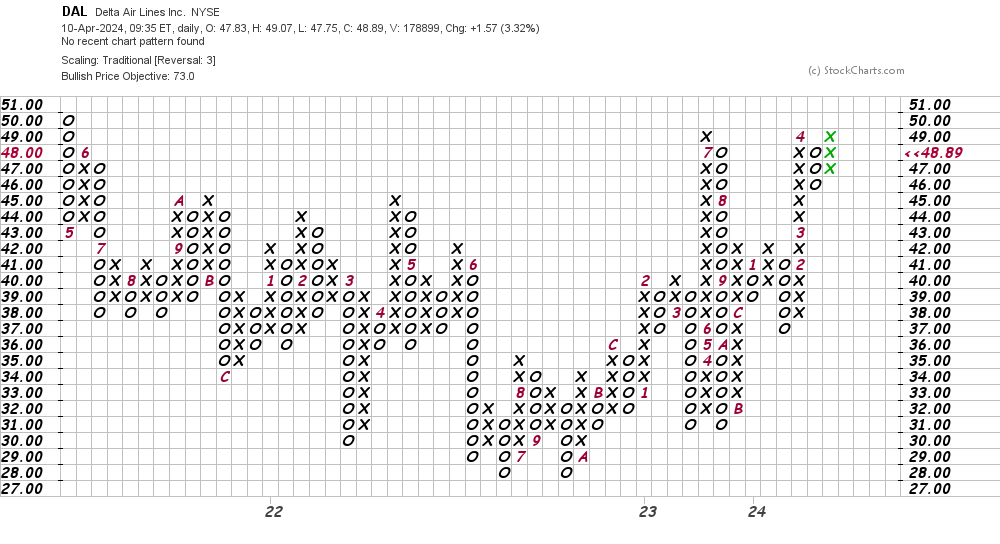
In this daily Point and Figure chart of DAL, below, I can see a potential upside price target in the $73 area. A trade at $51 is needed to refresh the uptrend.
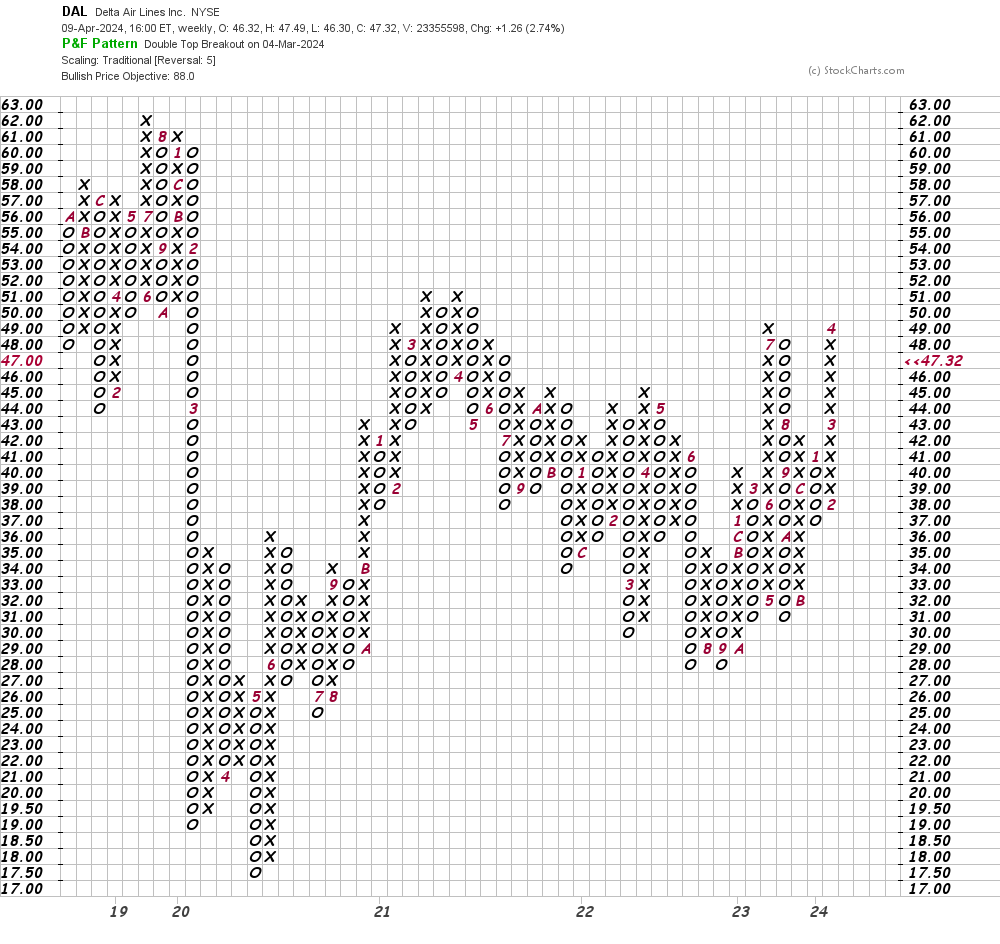
In this weekly Point and Figure chart of DAL, below, I used a five box reversal filter. Here the software reveals a price target in the $88 area. A trade at $52 is needed for an upside breakout.
Bottom line strategy: Aggressive traders could go long DAL below $48 or above $51. Risk to $45.
Employees of TheStreet are prohibited from trading individual securities.