Deere's Plowing Ahead After Earnings, But the Charts Need Some Fertilizer
The farming equipment maker beat in its quarterly report, but that can only get it so far.
You've reached your free article limit
You've read 0 of 1 free Pro articles.
Farming equipment maker Deere & Company DE reported unadjusted earnings per share of $6.29 Thursday morning that beat estimates by $0.65 and revenue of $13.15 billion, which beat by $2.36 billion. The stock is climbing higher in the premarket.
Let's put on our green Deere baseball cap and check out the charts and indicators.
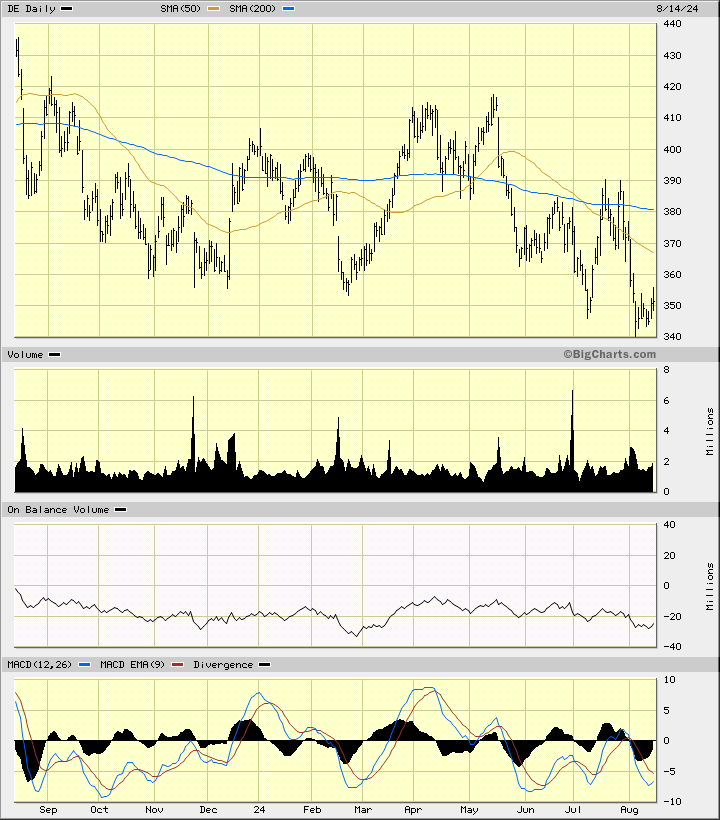
Look at this daily bar chart of DE, below. Prices are testing the underside of the declining 50-day moving average line. The slope of the 50-day average line and the slower-to-react 200-day moving average line are negative, so the longer-term trend is down.
The On-Balance-Volume (OBV) line has been in a weakening trend since the middle of April, telling me that sellers of DE have been more aggressive than buyers for a number of months ahead of this earnings release. This tells me that there has been more liquidation than accumulation. The Moving Average Convergence Divergence (MACD) oscillator is below the zero-line, so we may only get a cover-shorts buy signal if DE continues to rally.
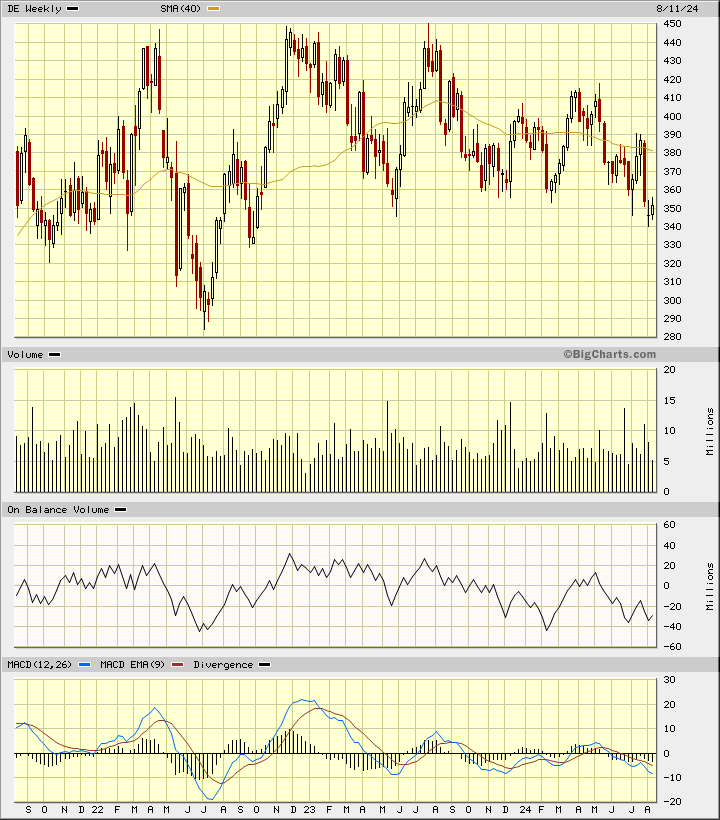
In this weekly Japanese candlestick chart of DE, below, I can see that prices have been in a downward sloping channel since early 2023. Prices trade below the declining 40-week moving average line.
The weekly trading volume histogram does not show me a pick up in activity ahead of earnings. The weekly OBV line has been in a downward trend telling us that sellers have been more aggressive than buyers for several months -- not a positive set up. The MACD oscillator is in a bearish alignment below the zero-line. It will take several weeks of price gains to change this indicator.
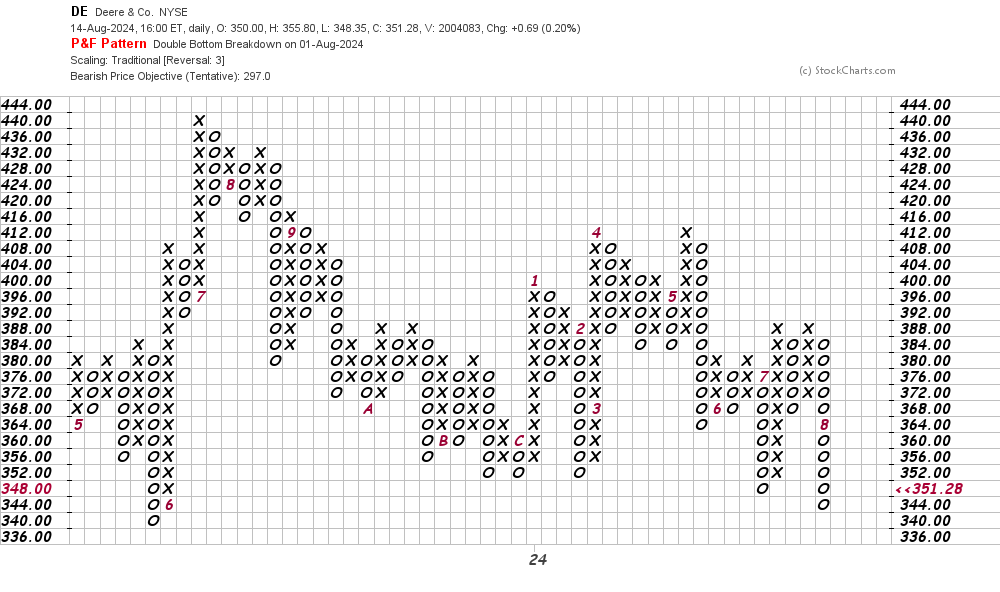
In this daily Point and Figure chart of DE, below, I can still see a downside price target being projected. It may take a trade at $392 to turn this chart bullish.
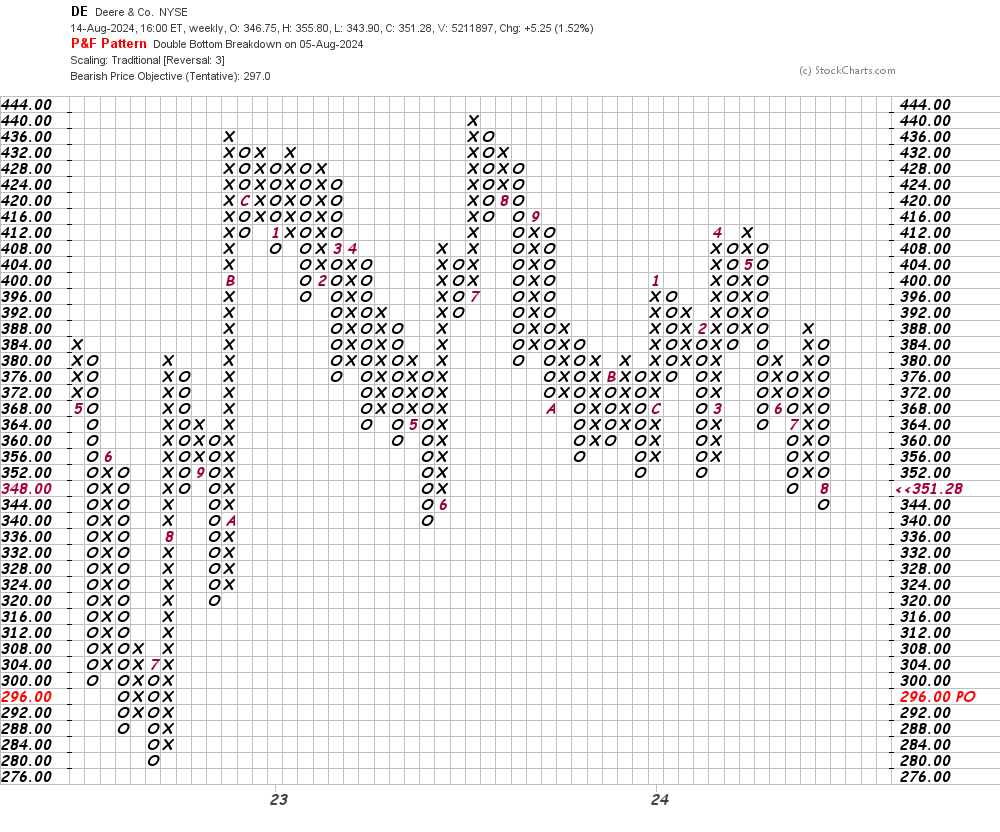
In this weekly Point and Figure chart of DE, below, a trade at $392 is needed to change the picture to bullish.
Bottom line strategy: One-day rallies can start a new trend, but I prefer to consider the trends already in force when looking for trends that are sustained. Without a strong-looking base pattern, I can't get too excited about the long side of DE.
Employees of TheStreet are prohibited from trading individual securities.