D.R. Horton Hears a Rally After Earnings, But What's the Pattern?
Let's examine the homebuilder's charts to see what direction stock prices will follow.
You've reached your free article limit
You've read 0 of 1 free Pro articles.
D.R. Horton DHI reported its fiscal third-quarter results Thursday and earnings and revenue beat estimates. The homebuilder also announced a $4 billion stock buyback.
Let's visit the sales office and check out the charts and indicators.
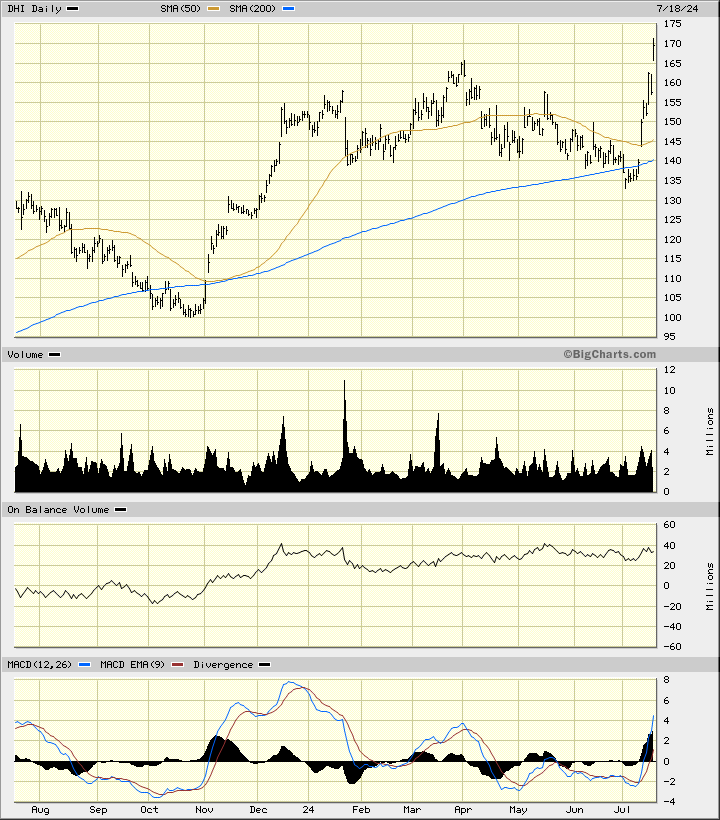
In the daily bar chart of DHI, below, I can see that the shares have challenged the $160-$165 area twice in recent weeks. Prices retreated from that area in late March/early April and it looks like they may retreat from that zone again.
DHI shares have been making lower lows and higher highs since January to form what I see as a broadening pattern. Instead of coming to an apex like a triangle, the pattern is making wider and wider up-and-down swings. This pattern can be either a continuation pattern (keeps going higher) or a reversal pattern and prices go lower.
The stock trades above the rising 50-day moving average line and the rising 200-day line. Prices tested and briefly broke the 200-day line earlier this month. Was that a sign of weakness or strength?
The trading volume has declined from its pace in late January. The On-Balance-Volume (OBV) line has been stalled since December. The trend-following Moving Average Convergence Divergence (MACD) oscillator was below the zero line for several weeks and just popped back above it as prices rallied.
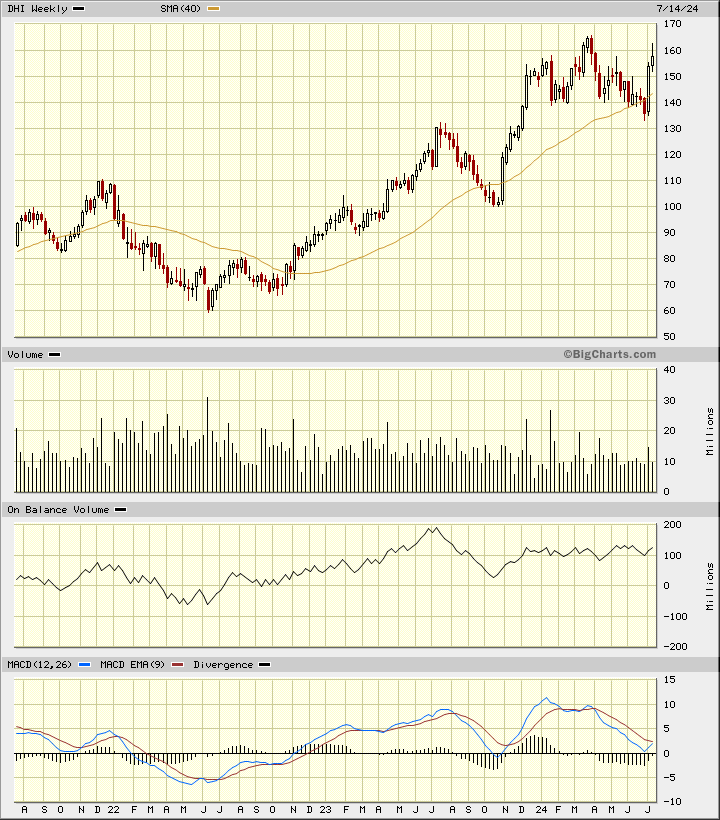
In the weekly Japanese candlestick chart of DHI, below, I see a mixed picture. The shares are in a longer-term uptrend and trade above the rising 40-week moving average line. Prices made a top reversal pattern in May (bearish engulfing pattern) and the latest weekly candle has an upper shadow telling me that traders are rejecting the highs.
The trading volume has declined in the past five months. The weekly OBV line has been flat since December and is not confirming a move to higher prices. The MACD oscillator corrected down to the zero line and is trying to cross to the upside for a new outright buy signal. We'll see.
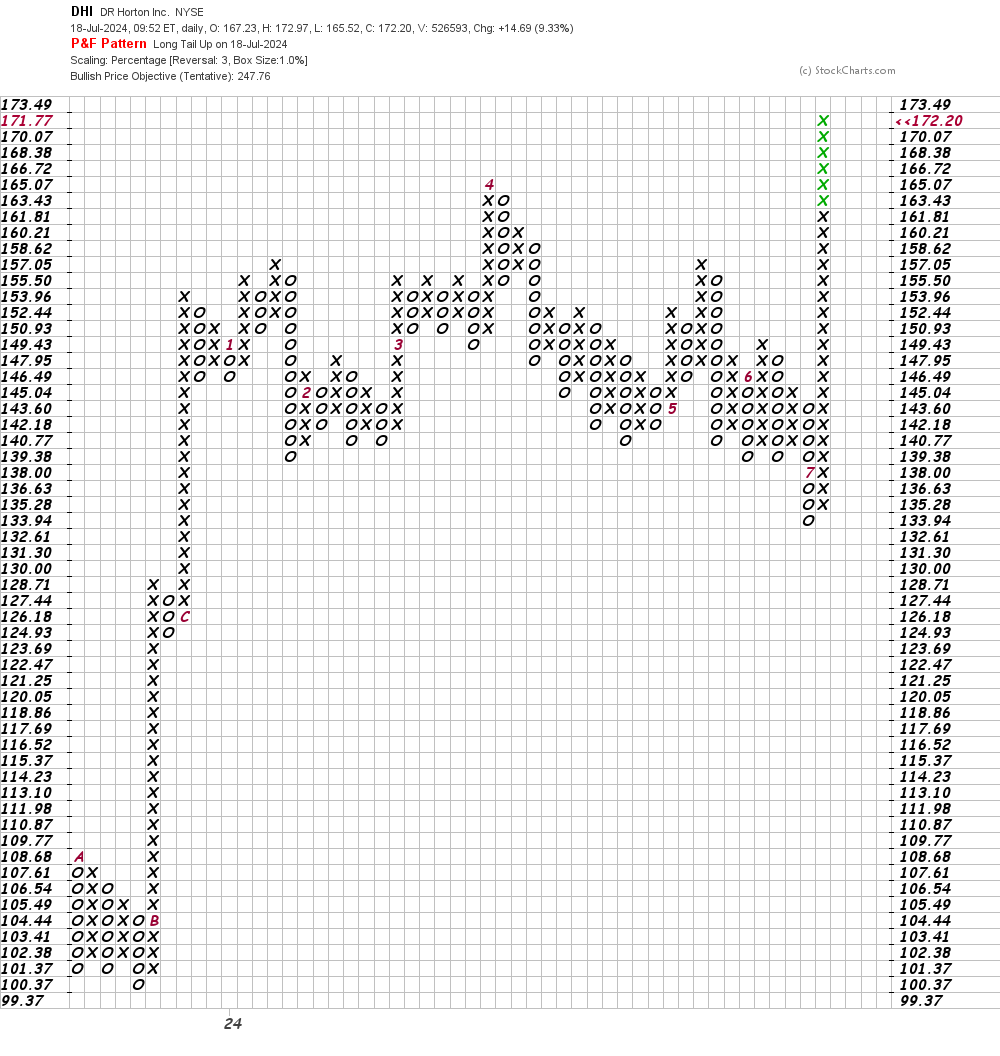
In this daily Point and Figure chart of DHI, below, I can also see the broadening pattern with no gaps, no volume, and no sense of time. The price target measures to the $248 area and this assumes this is a continuation pattern.
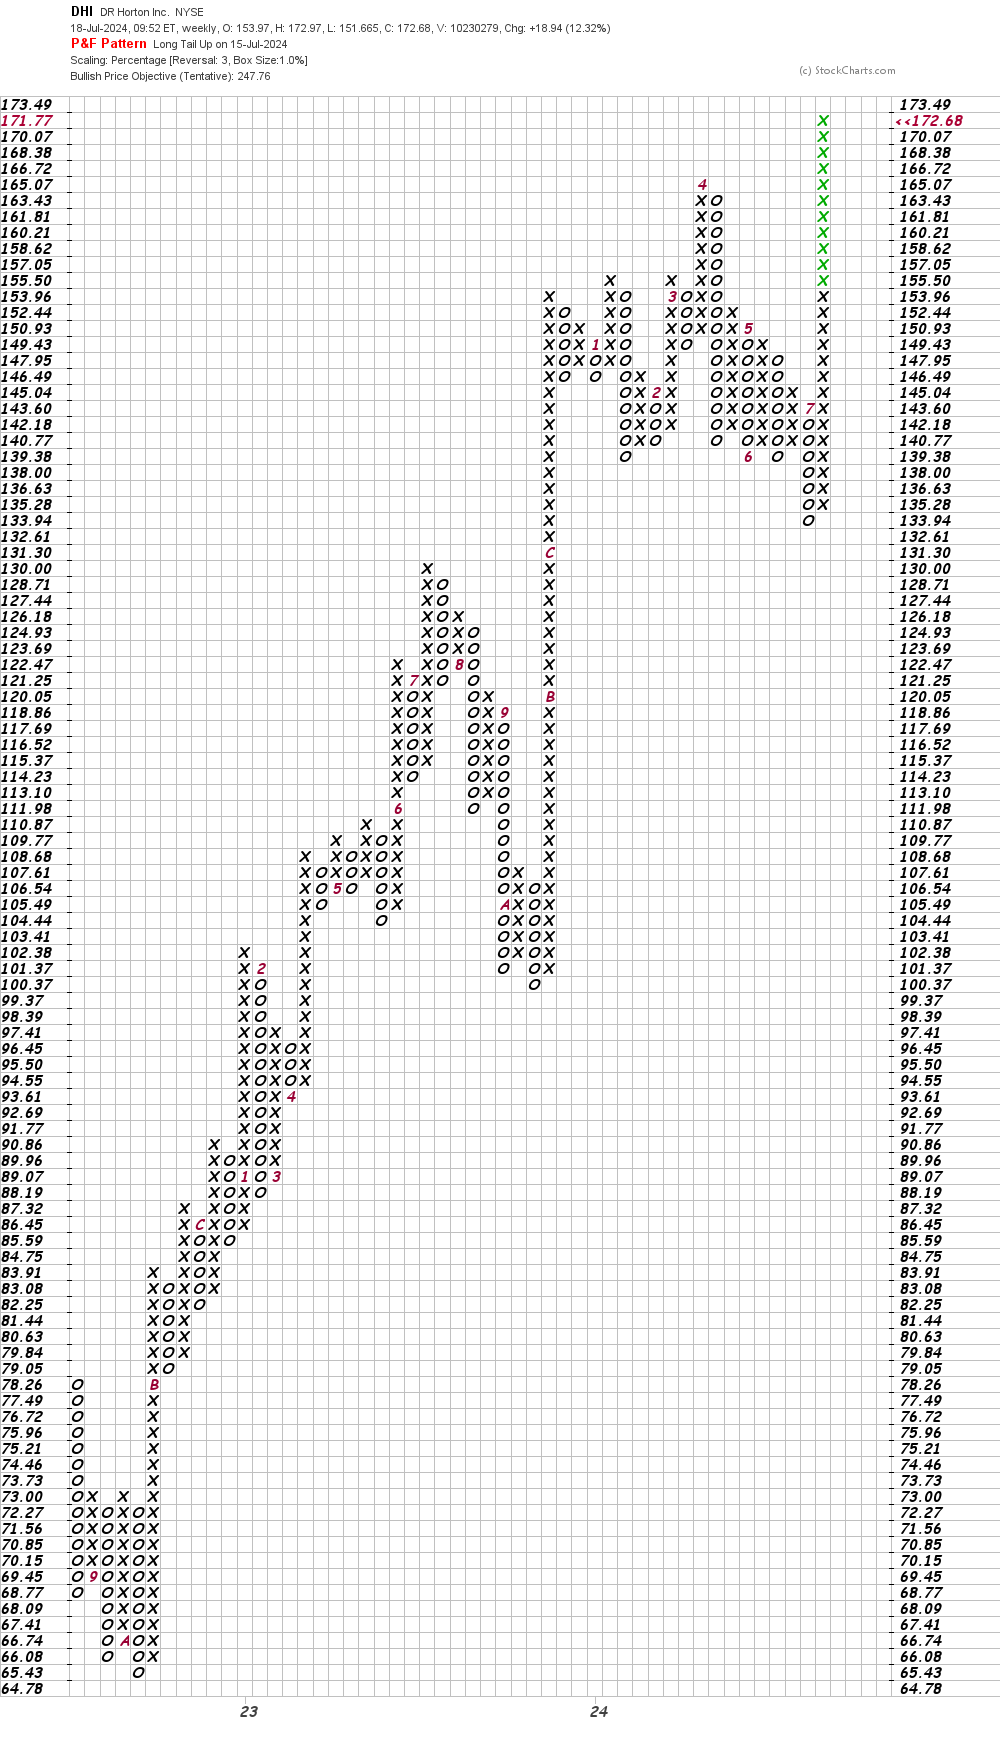
In this weekly Point and Figure chart of DHI, below, I can see the same bullish price target as the daily chart above.
Bottom-line strategy: Continuation pattern and higher prices or reversal pattern and lower prices? I would step aside for a few days to see what direction prices will follow.
Employees of TheStreet are prohibited from trading individual securities.