Be Careful of the Sharp Rally From CrowdStrike
Rising stock prices for the cybersecurity firm might push traders to sell the early strength, which might not last.
You've reached your free article limit
You've read 0 of 1 free Pro articles.
Cybersecurity firm CrowdStrike Holdings CRWD is rallying sharply higher early Wednesday after the firm reported better than expected 1Q25 earnings results. CrowdStrike reported Tuesday night a Non-GAAP EPS of $0.93 which beat by $0.04 and revenue of $921.04 million which beat by $16.22 million. Let's check out the position of the charts and indicators.
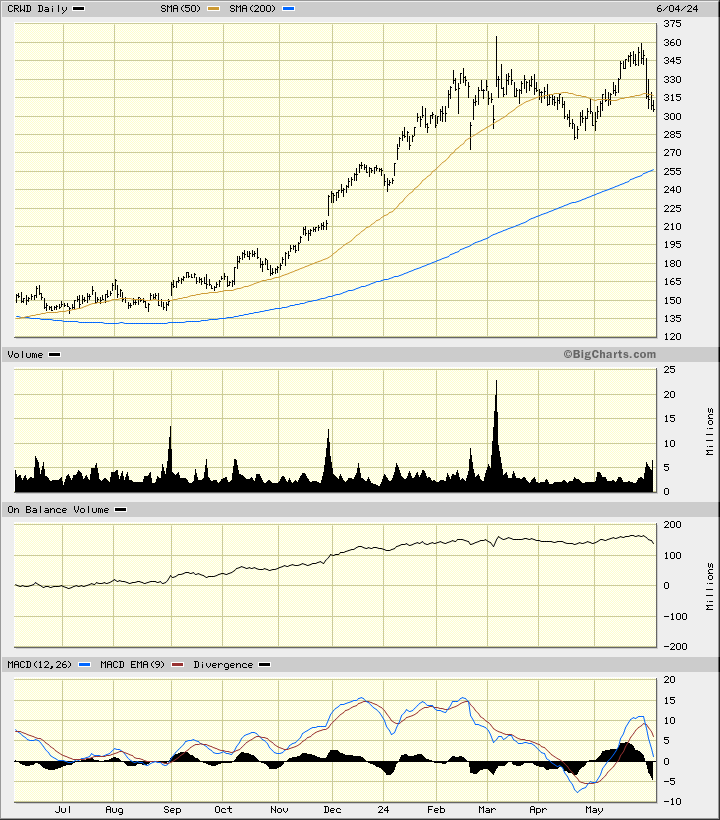
In this daily bar chart of CRWD below, I can see that CRWD is in an uptrend from the lows made back in August. Prices made gains into February before turning sideways. CRWD has traded around the 50-day moving average line but is now above this indicator. The slope of the 200-day moving average line is positive. The trading volume has been steady and does not show us a pattern of expansion. The On-Balance-Volume (OBV) line shows improvement into February followed by a sideways or neutral trend as buyers and sellers appear to be in balance. The trend-following Moving Average Convergence Divergence (MACD) oscillator is currently correcting lower but that condition could shift quickly if today's early gains are lasting.
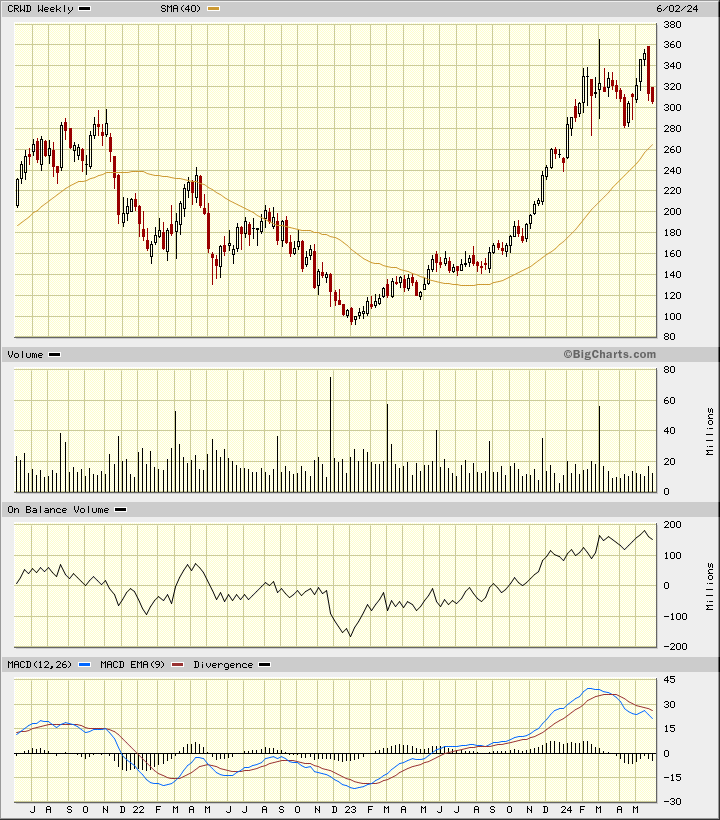
In this weekly Japanese candlestick chart of CRWD below, I see a mixed picture. Prices are in a longer-term advance and trade above the rising 40-week moving average line. The weekly trading volume is not increasing and that is a "problem area." The weekly OBV line has turned choppy the past three months. The MACD oscillator has been correcting lower the past three months or so. The middle of a recent large, red (bearish) candle could provide some resistance.
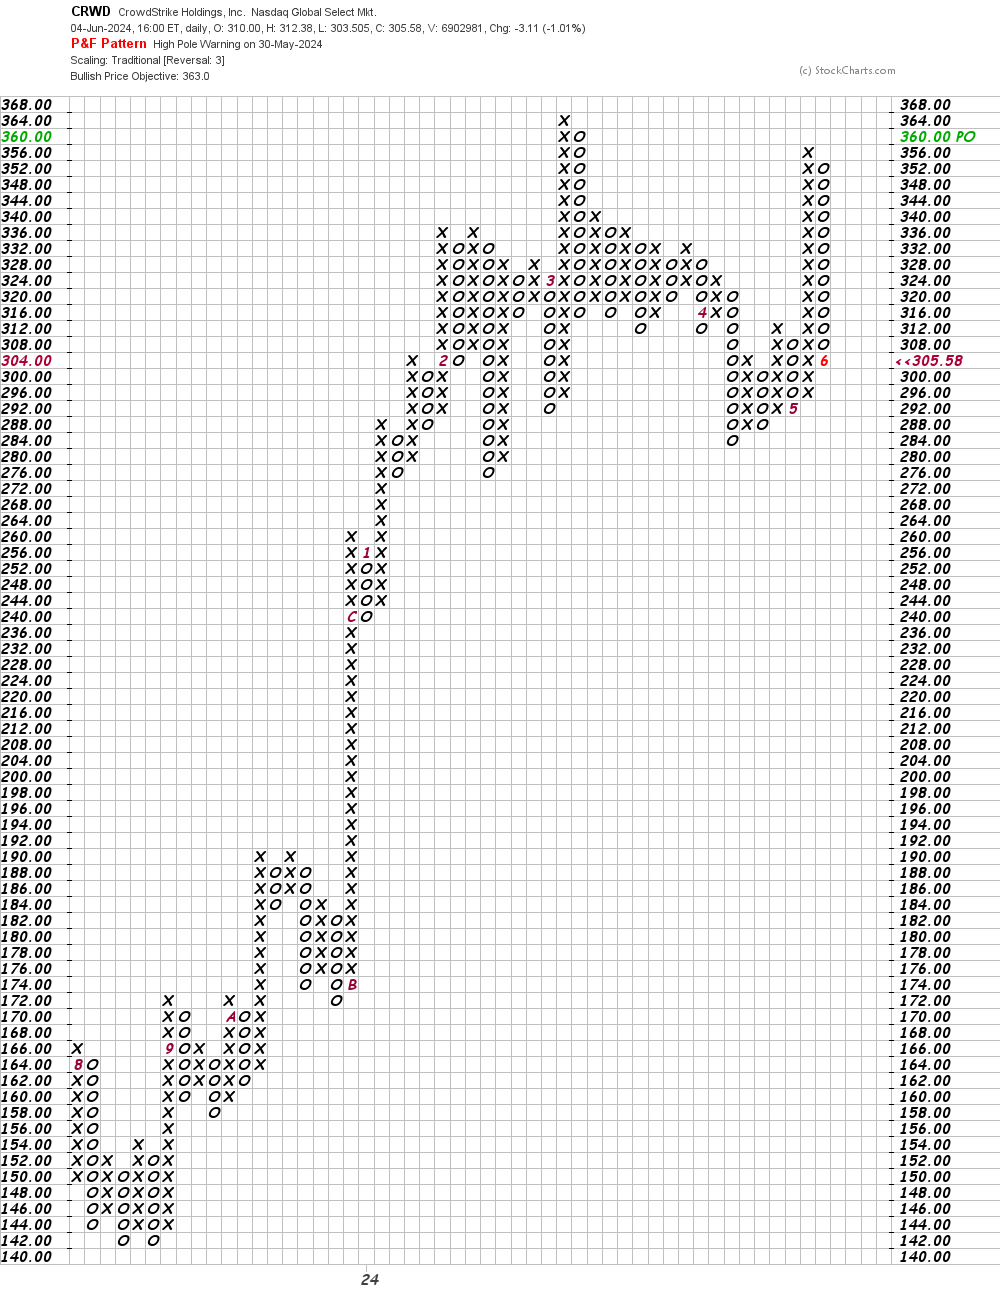
In this daily Point and Figure chart of CRWD below, I can see a price target in the $363 area. Prices are trading around $331 in the pre-market Wednesday.
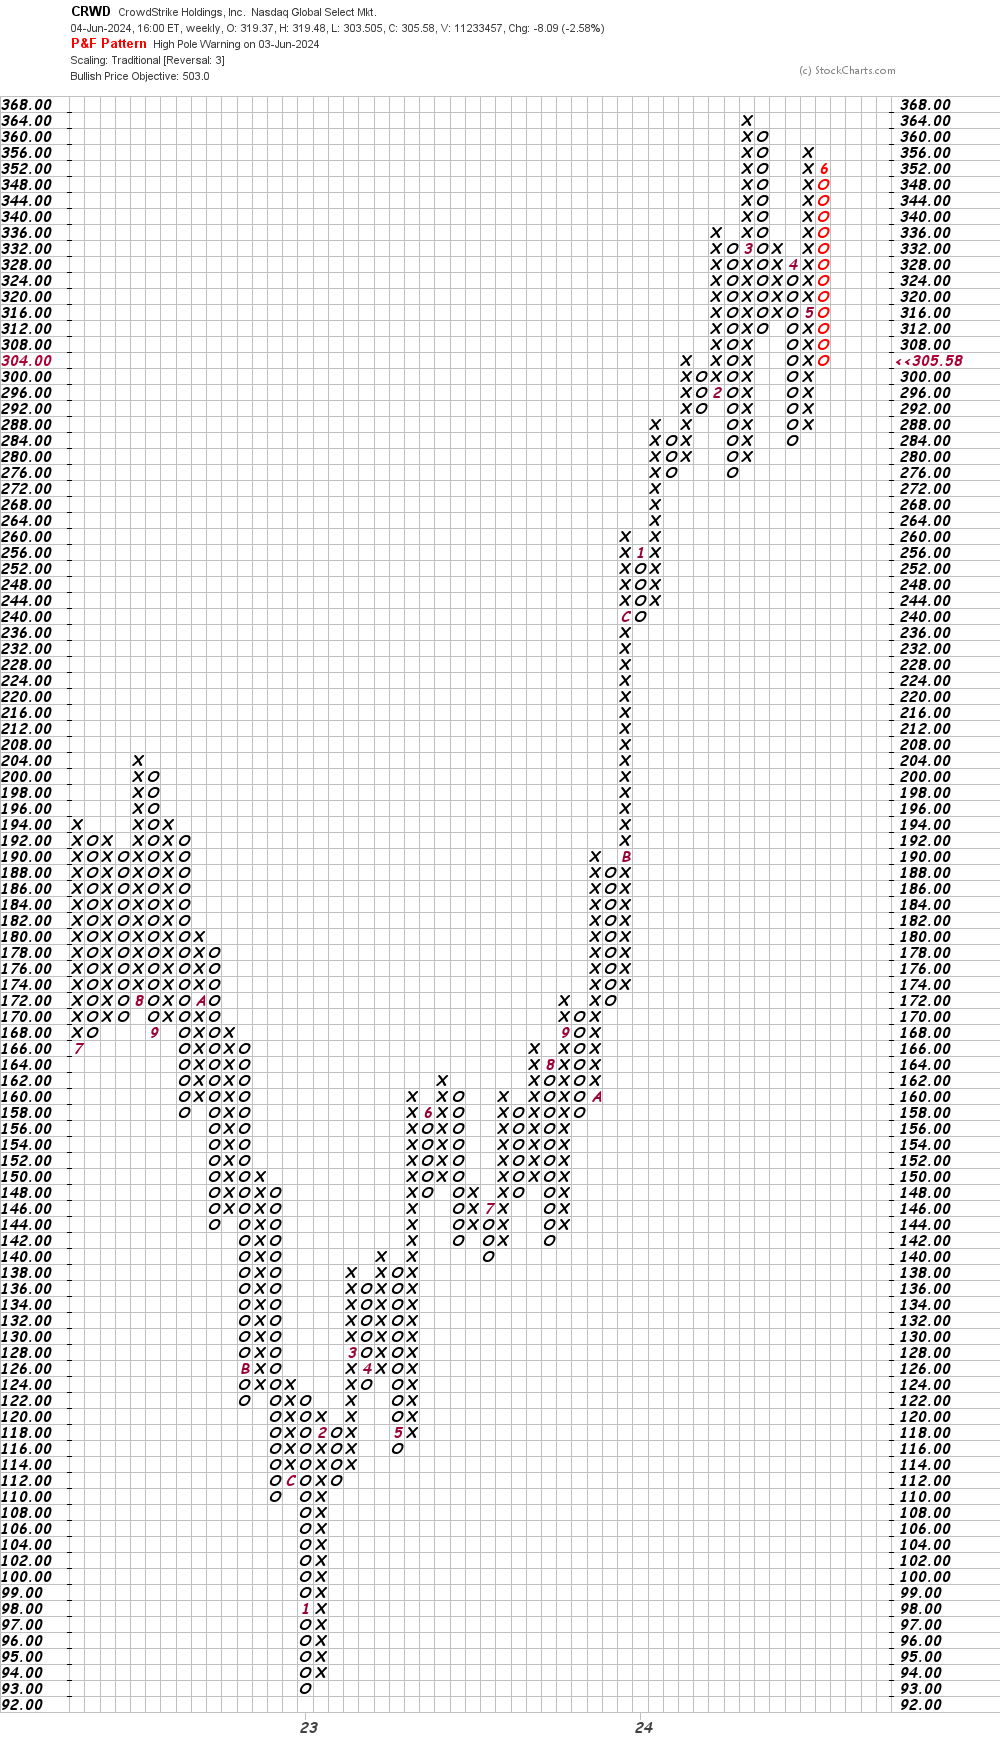
In this weekly Point and Figure chart of CRWD, below, the software suggests a potential price target in the $503 area.
Bottom line strategy: Shares of CRWD are poised to open sharply higher Wednesday but the charts and indicators were not particularly bullish before today. This condition could result in traders selling the early strength. Traders should be patient and not buy the early strength as it might not last. We'll see.
Employees of TheStreet are prohibited from trading individual securities.