Costco Is the Most Efficiently Run Retailer, But I'd Rather Own This One
The balance sheet, while not so hot looking on the surface, is actually far better than what you see at other big box retailers.
You've reached your free article limit
You've read 0 of 1 free Pro articles.
What is perhaps the most efficient retailer in the nation, if not the world, reported its fiscal third quarter financial results on Thursday evening.
For the three-month period ended May 12th, Costco COST posted a GAAP EPS of $3.78 on revenue of $58.515B. The top line print beat Wall Street by more than half a billion dollars, while reflecting year over year growth of 9.1%, as the bottom line print beat Wall Street by a dime.
Comp sales across the company were up 6.2%, or an even 6% if adjusted for gasoline prices and foreign currency exchange rates. Within that number, Canadian comp sales were up 7.7%, or 7.4% adjusted, other international comp sales were up 7.7% or 8.5% adjusted, while e-commerce comp sales were up 20.7% on both a nominal and adjusted basis.
Operations
As revenue grew 9.1% to $58.515B, merchandise costs grew 8.5% to $51.173B. This left a gross profit of $7.342B (+13.4%) as gross margin improved from 10.32% to 10.84%. That is great but was just a hair below Wall Street's expectations for a gross margin of 10.89%. Administrative/selling expenses increased 7.3% to $5.145B, leaving operating income of $2.197B (+30.9%). Operating margin improved from 3.12% to 3.75%. Again, this was positive. Again, it just fell short of Wall Street's consensus projection of 3.77%.
After accounting for interest, taxes and other income, net income landed at $1.681B, up 29.1% from the year ago comparison. This works out to a GAAP EPS of $3.78 once share count is diluted, up from $2.93 for that year ago period.
Fundamentals
For the first nine months of the firm's fiscal year, Costco generated operating cash flow of $8.381B, while spending $3.133B on property and equipment. That left free cash flow of $5.248B, up from $4.576B for the first nine months a year ago. Out of that number, the firm repurchased a small amount's worth of common stock ($484M), but also paid out $8.527B in cash dividends to shareholders. Reminder that this was unusual and included a $15 per share special dividend paid back in January.
Glancing at the balance sheet, Costco ended the quarter with a cash position of $11.499B, inventories of $17.43B and current assets of $33.288B. Current liabilities printed at $35.361B, which doesn't look so good. That number includes both short-term debt of $1.077B and deferred membership fees (revenue) of $2.553B.
All this puts the firm's headline current ratio at a less than spectacular 0.94. Once adjusted for those unearned revenues, the current ratio rises to 1.01. Still not great, but not a failing score. Kind of like a C-. Screws up your grade point average but doesn't get you kicked out of school.
Total assets amount to $67.911B. This includes no value for intangible assets. We do appreciate that. Total liabilities less equity comes to $46.14B, including another $5.834B in debt labeled as long-term. Bottom line, the firm can pay off its debt-load out of cash, and still drives solid free cash flow. As long as those special dividends remain rare, this balance sheet, while not so hot looking on the surface, is actually far better than what you see at other big box retailers.
Wall Street
To this point, I have come across nine highly rated (4+ stars at TipRanks) who have opined on COST since these earnings were released. Among the nine, we have eight "buy" or buy-equivalent ratings and one "hold" rating. One of the "buys" did not set a target price, so we are working with eight of those.
The average target price across these eight analysts comes to an even $842 with a high of $860 (Greg Melich of Evercore ISI) and a low of $775 (Edward Kelly of Wells Fargo). Once omitting these two as potential outliers, the average target across the other six rises to $850.17.
My Thoughts
The firm posted another very good quarter. Both gross and operating margins increased nicely, but both fell just short of expectations. That is why the stock has been a bit weak overnight. This is still the most efficient run, less damaged by shrink in this era of "widespread street crime" big box retailer of its kind.
Investors pay a premium for that efficiency and for that security. Costco trades at 47 times forward looking earnings and 17.5 times book. Walmart WMT trades at 27 times forward looking earnings and 6.4 times book. Target TGT trades at 16 times forward looking earnings and just five times book.
Target might be undervalued, but then again, this is a poorly managed company, and you get what you pay for. Walmart is a well-run company, with a tough balance sheet that will need some time to unscrew. Costco has the strongest balance sheet of the three.
Costco just paid out their occasional special dividend. The firm is overdue for a membership fee increase, but has been trying to hold back, which does show itself to be a valued member of any community. That valuation is hard to look at.
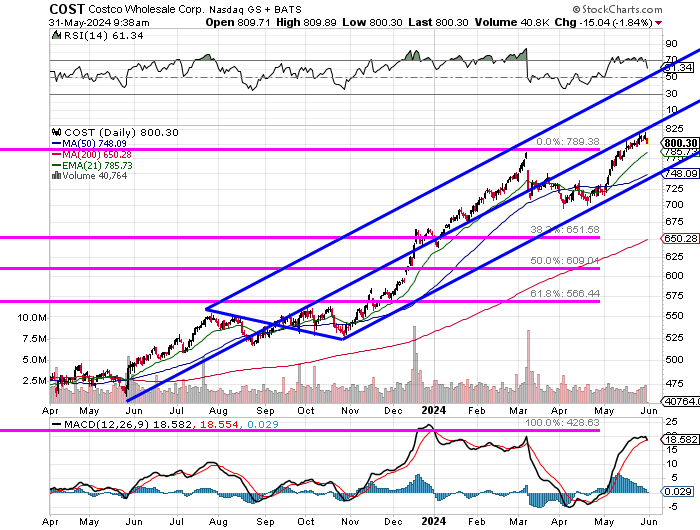
COST continues to trade neatly inside of a rising Andews' Pitchfork model that dates back to last May. Relative strength is weakening a bit, as the daily MACD (moving average convergence divergence) is just coming off of that April/May rally inspired hike. The MACD has a bearish look to it right now.
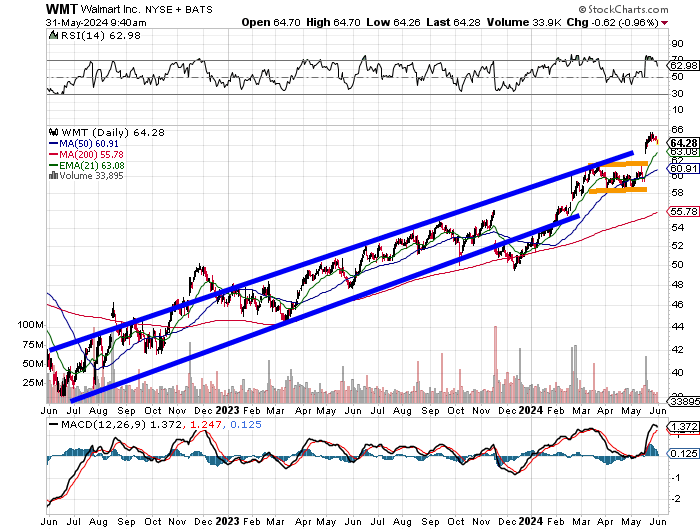
I own neither stock, but if WMT can find support at the top trendline of this ascending price channel, rather than fill the recent gap that would require a $59 tick, then for at least the short to medium term, I would rather own Walmart than Costco.
That's if I had to own one, which I do not.
At the time of publication, Stephen Guilfoyle had no position in the securities mentioned.
