Corning's Charts Could Support Further Gains
Here's how to trade it.
You've reached your free article limit
You've read 0 of 1 free Pro articles.
Specialty glass and ceramics maker Corning GLW has made a base pattern on the charts. Let's check.
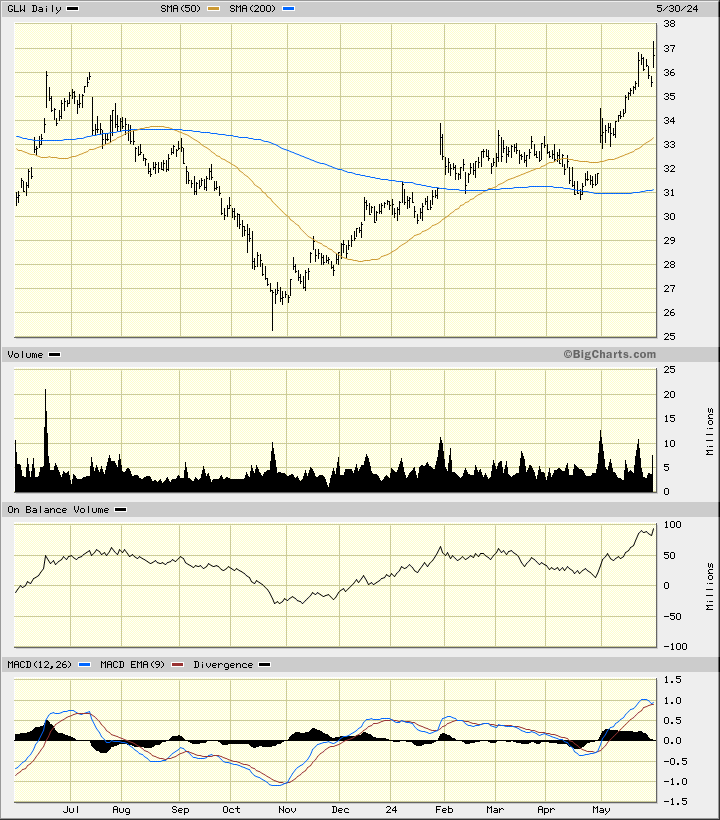
In this daily bar chart of GLW, below, I can see that prices made a low in October followed by a rally and a higher low in April. GLW trades above the rising 50-day moving average line and above the rising 200-day moving average line.
The On-Balance-Volume (OBV) line has been moving higher since October and mirrors the price action, confirming the price gains so far. The Moving Average Convergence Divergence (MACD) oscillator is above the zero line but shows some recent narrowing telling us that the trend-strength is weakening.
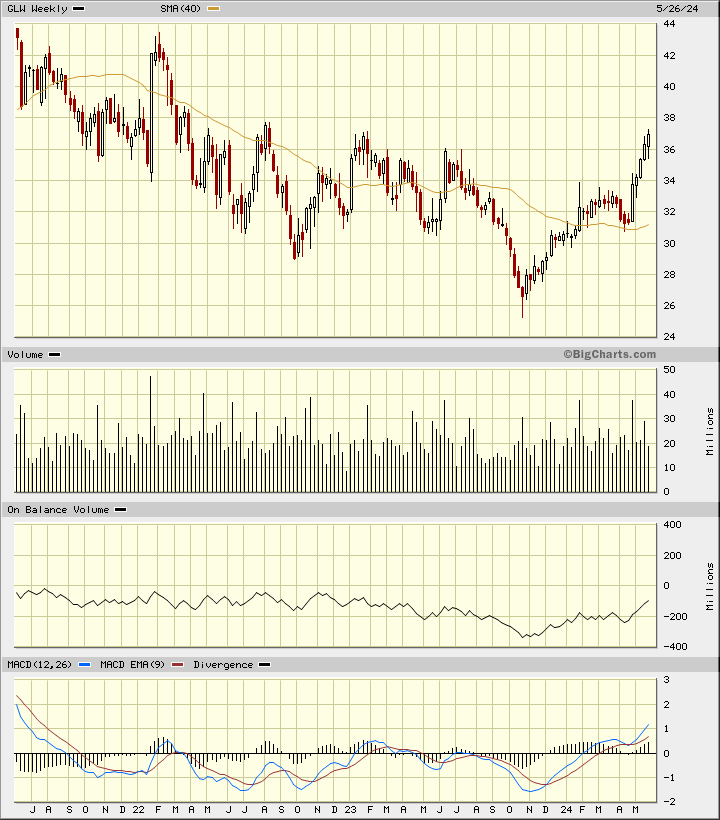
In this weekly Japanese candlestick chart of GLW, below, I can see that prices have broken a longer-term downtrend (not drawn). GLW now trades above the rising 40-week moving average line.
The weekly OBV line has been moving upwards since November as buyers act more aggressively than sellers. The MACD oscillator is in a bullish alignment above the zero line. The lack of upper shadows or a top reversal pattern suggest that further gains are possible.
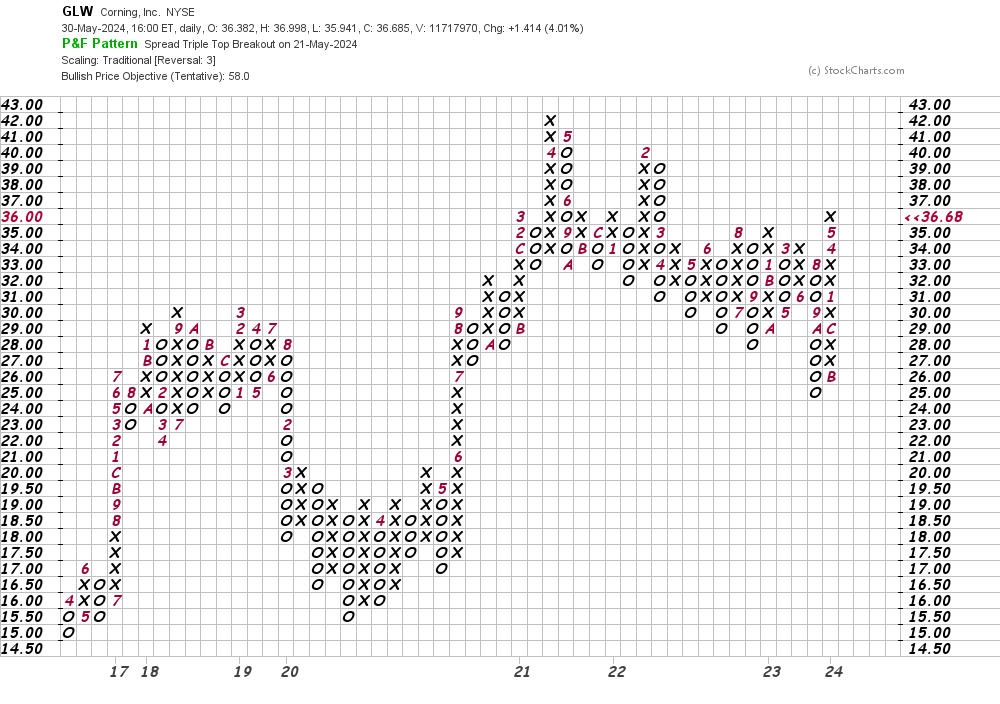
In this daily Point and Figure chart of GLW, below, I can see an upside price target in the $58 area.
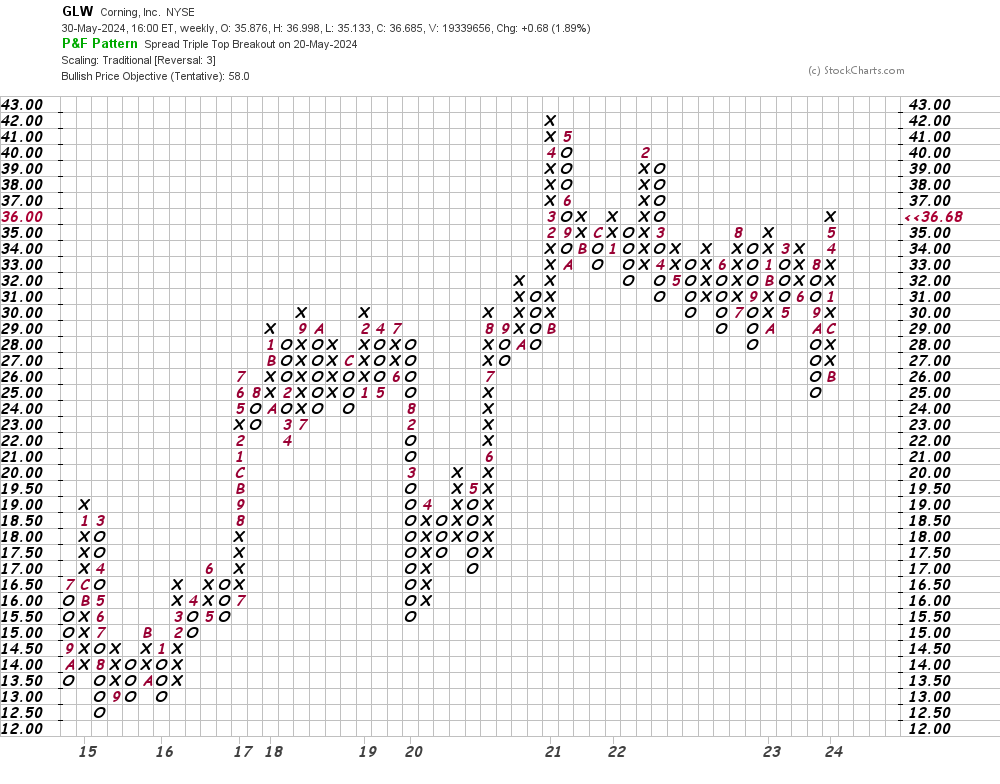
In this second Point and Figure chart of GLW, below, I used weekly price data and the software gave me the same price target as the daily chart above: $58.
Bottom line strategy: In the short-run we may see GLW move sideways around $36. After a few weeks of sideways action we should see GLW resume its advance. Trade accordingly.
Employees of TheStreet are prohibited from trading individual securities.