Conagra: Out of the Frying Pan and Into the Fire
After its latest quarterly earnings, shares of the consumer packaged foods company are feeling the heat. Here's what traders need to know.
You've reached your free article limit
You've read 0 of 1 free Pro articles.
Conagra Brands CAG reported a fiscal fourth-quarter revenue miss Thursday morning and guided their FY 25 EPS below estimates. The stock is moving lower so let's check the charts and indicators for some guidance.
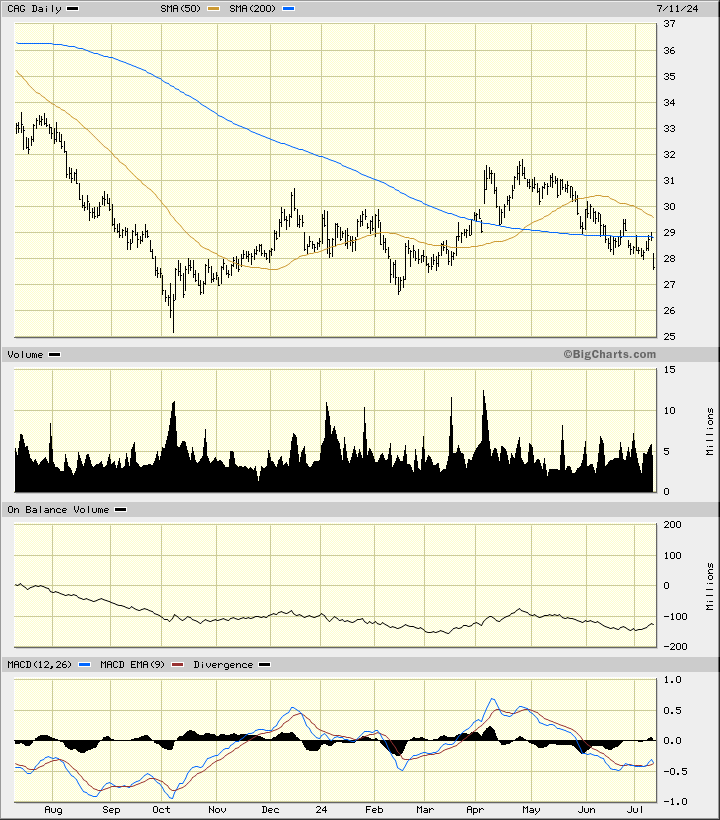
In the daily bar chart of CAG, below, I can see that the shares have made a new low for the move down and trade below the declining 50-day moving average line and below the slower-to-react 200-day moving average line.
The On-Balance-Volume (OBV) line has worked lower the past 12 months telling me that sellers of CAG have been more aggressive than buyers. The Moving Average Convergence Divergence (MACD) is below the zero line and struggling to make a cover shorts buy signal.
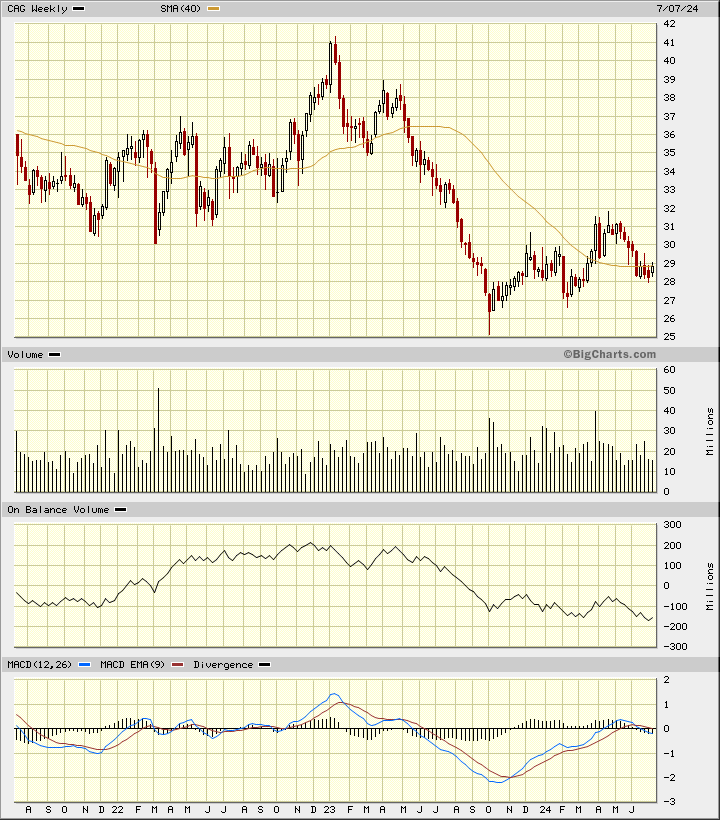
In the weekly Japanese candlestick chart of CAG, below, I see a weak picture. Prices are trading below the 40-week moving average line.
The weekly OBV line has been in a downtrend the past two years. The MACD oscillator has crossed back below the zero line for an outright sell signal.
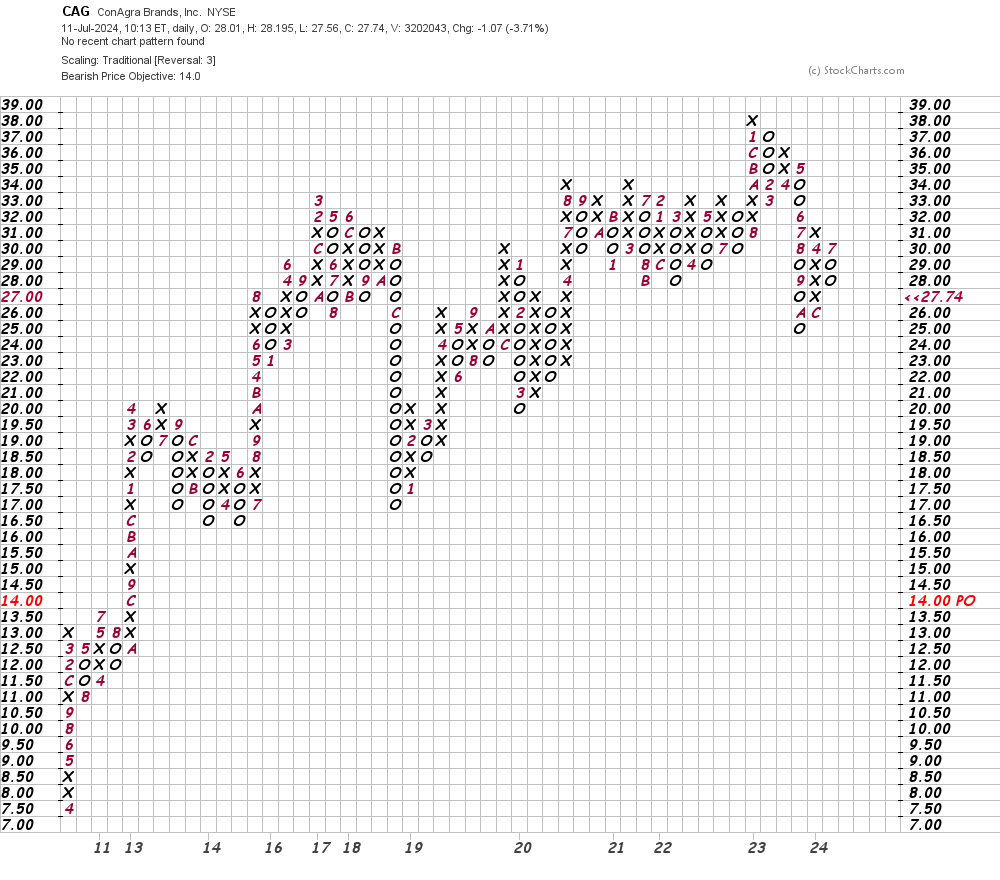
In this daily Point and Figure chart of CAG, below, I can see that the software is now projecting a potential downside price target in the $14 area.
In this weekly Point and Figure chart of CAG, below, I can see a similar picture as the daily chart above. Here too it projects a $14 price target.
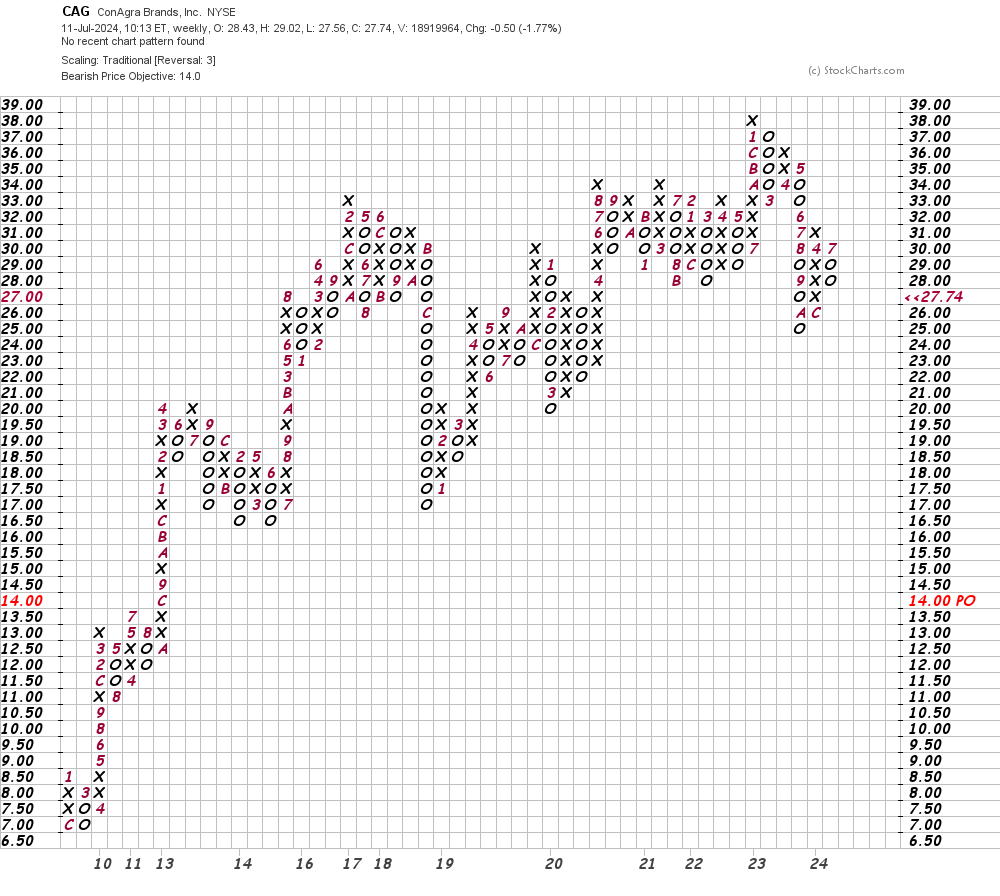
Bottom-line strategy: It looks like CAG could decline to retest the $27-$25 area. If this zone of support is broken then further declines are possible. I am not sure $14 will be seen but you never know.
Employees of TheStreet are prohibited from trading individual securities.