Cboe Global Markets Continues to Weaken
A downside breakout could be coming soon.
You've reached your free article limit
You've read 0 of 1 free Pro articles.
Cboe Global Markets CBOE is not expected to report earnings until May 3rd for their fiscal quarter ending Mar 2024, but the stock has been slipping lower in recent weeks.
I reviewed the charts of the CBOE along with the CME and ICE back on February 29 and wrote that "In the lower panel is the 12-day price momentum study and here we can see equal highs in momentum from November to January to February. This is a bearish divergence when compared to the price action and could foreshadow weaker prices ahead."
Let's check on the CBOE charts again.
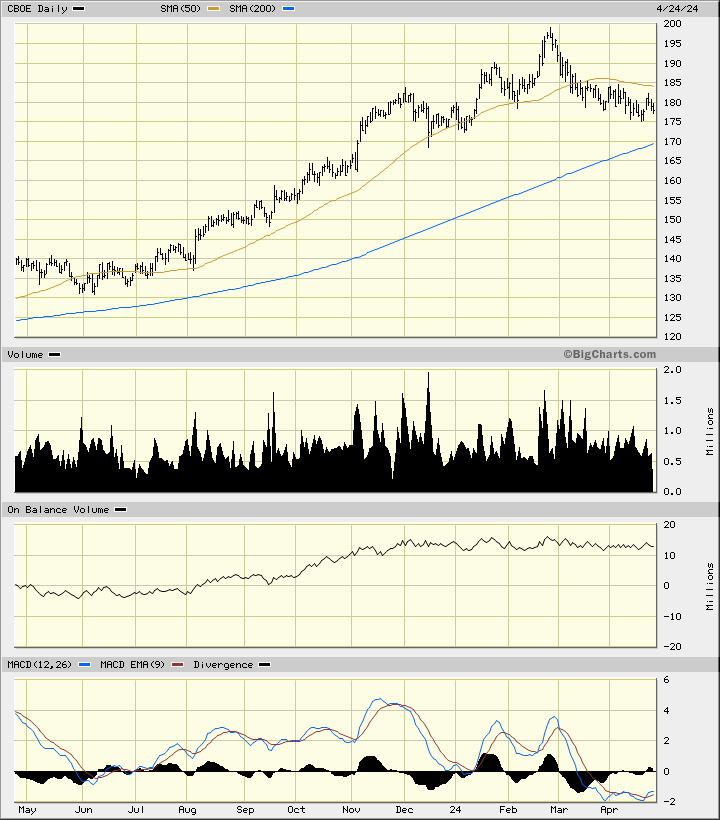
In this daily bar chart of the CBOE, below, I can see that prices have weakened since our end of February review. CBOE now trades below the declining 50-day moving average line. The slower-to-react 200-day moving average line has a positive slope and intersects around $170. The trading volume histogram shows weakening turnover the past two months.
The daily On-Balance-Volume (OBV) line has been flat/neutral since early December. The Moving Average Convergence Divergence (MACD) oscillator is below the zero line and struggling to show improvement.
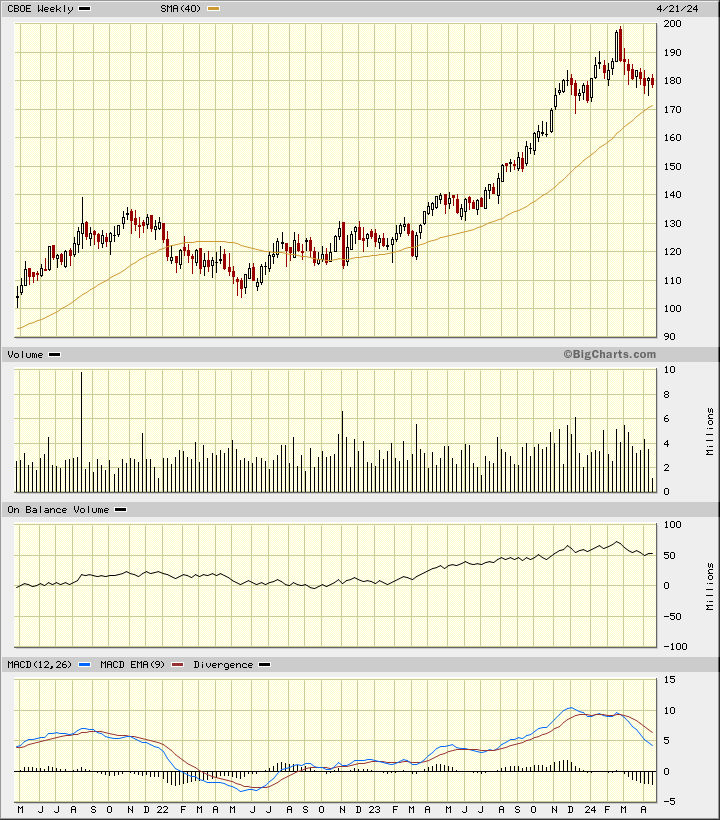
In this weekly Japanese candlestick chart of CBOE, below, I can see some weakness developing. Prices are still above the rising 40-week moving average line but a large bearish engulfing pattern in February suggests we could see further price weakness in the weeks ahead.
The weekly OBV line shows weakness since the middle of February and tells me that sellers of CBOE have been more aggressive than buyers. The MACD oscillator peaked in early December and continues to weaken.
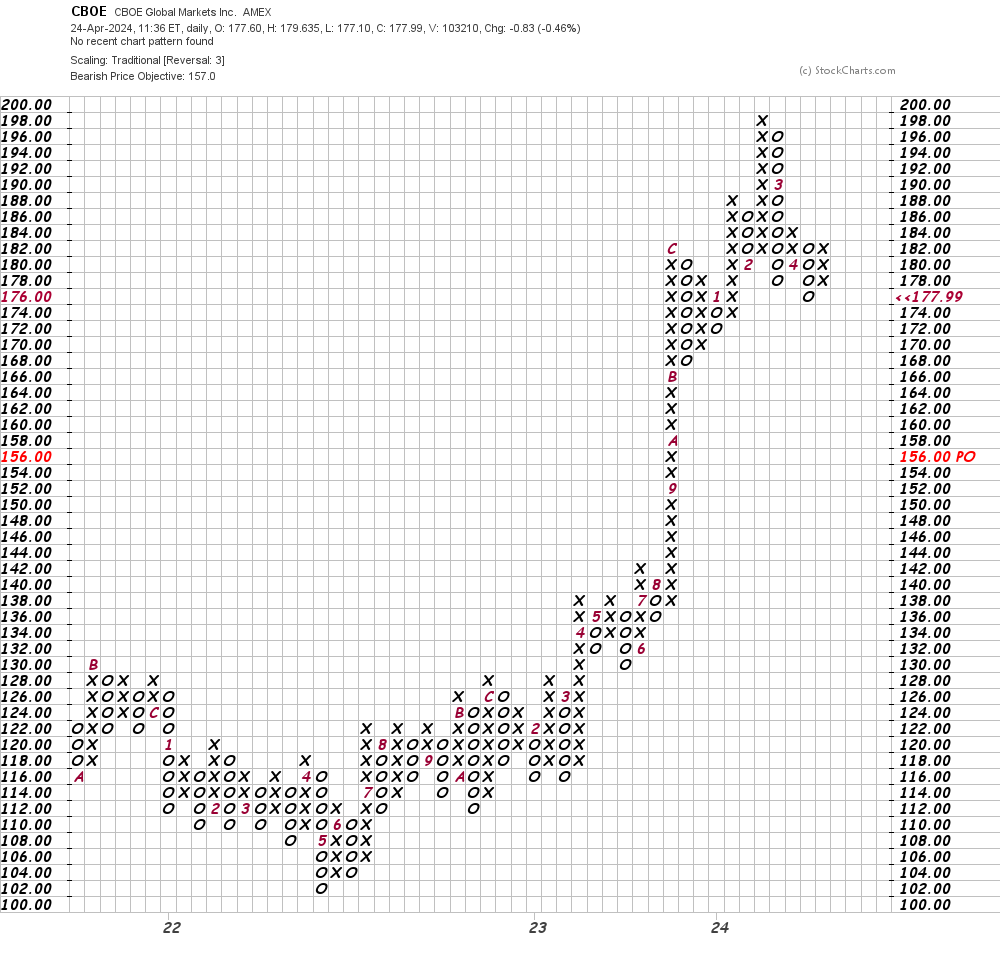
In this daily Point and Figure chart of CBOE, below, I can see a potential downside price target in the $157 area.
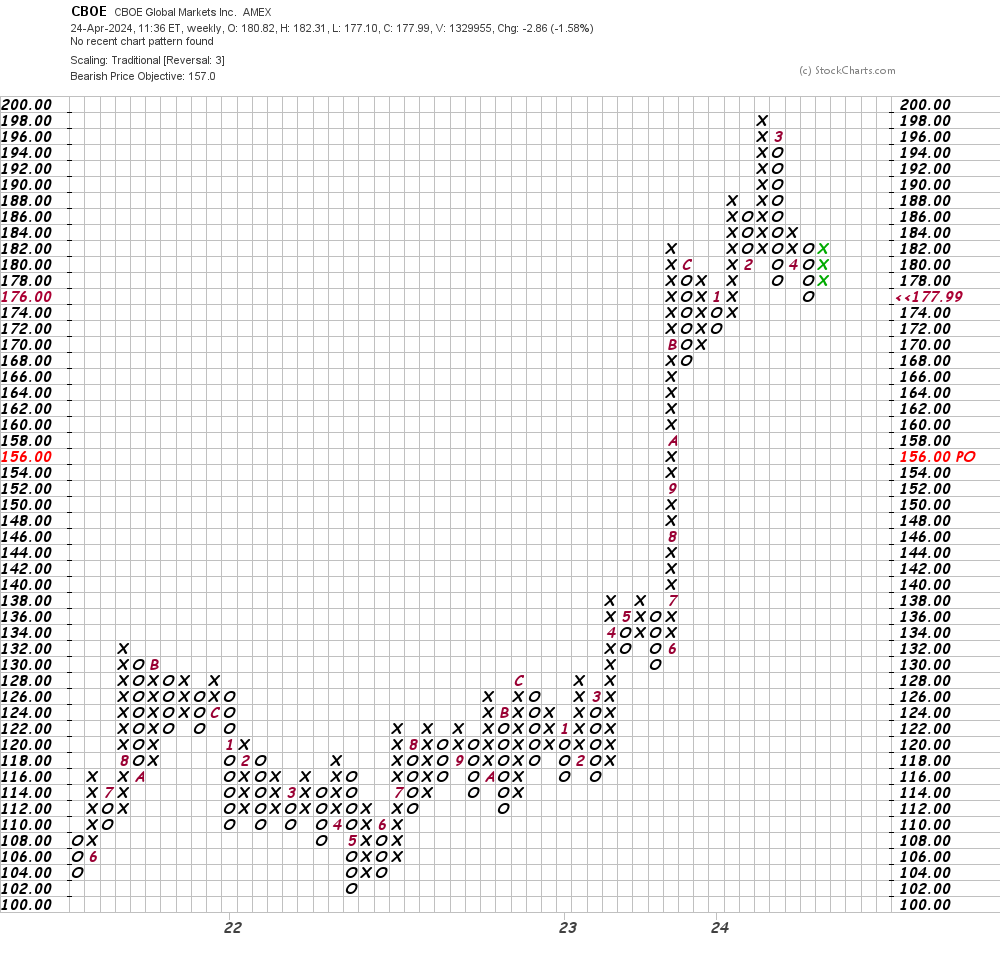
In this weekly Point and Figure chart of CBOE, below, I can see the same downside price target of $157 as shown on the daily chart above.
Bottom line strategy: The price of CBOE has been forming a top since November. A neckline and support in the $175-$170 area is still keeping prices from falling further for now. A downside breakout could be coming soon.
Employees of TheStreet are prohibited from trading individual securities.