Boeing's Charts Still Show Little 'Spirit'
Let's check the technicals amid acquisition news.
You've reached your free article limit
You've read 0 of 1 free Pro articles.
Boeing Co. BA reportedly plans to acquire the troubled supplier Spirit Aerosystems SPR for $37.25 per share in an all-stock deal. Let's check out the charts of BA to see if this increases the chances of a rally.
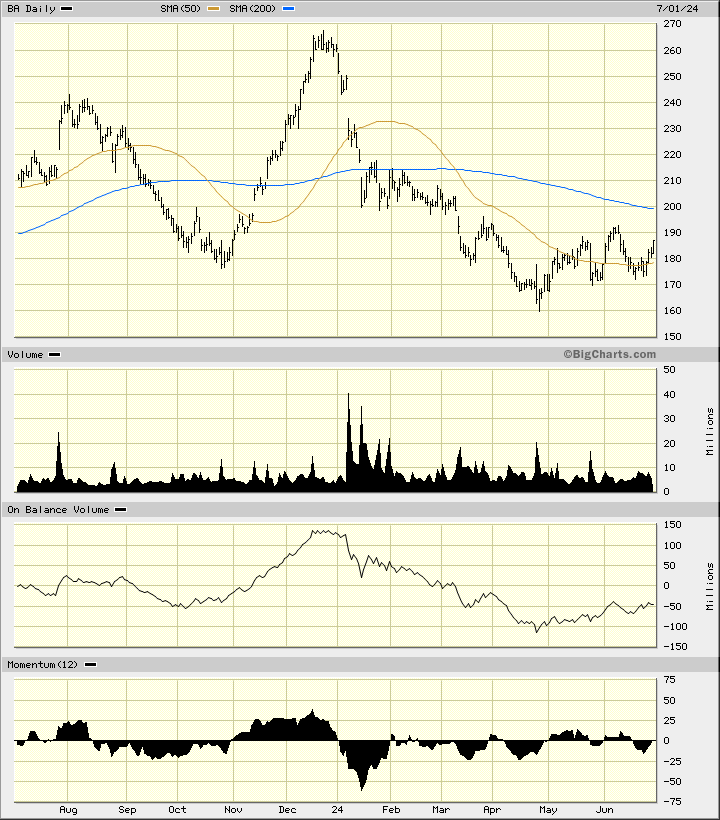
In this daily bar chart of BA, below, I can see that prices have improved a little since making a low in late April. Prices are trading above the 50-day moving average line. The 200-day moving average line has a negative slope and intersects up around $200 per share.
The On-Balance-Volume (OBV) line shows some improvement since late April. The 12-day price momentum study in the lower panel shows us higher lows since January and is making a bullish divergence when compared to the price action.
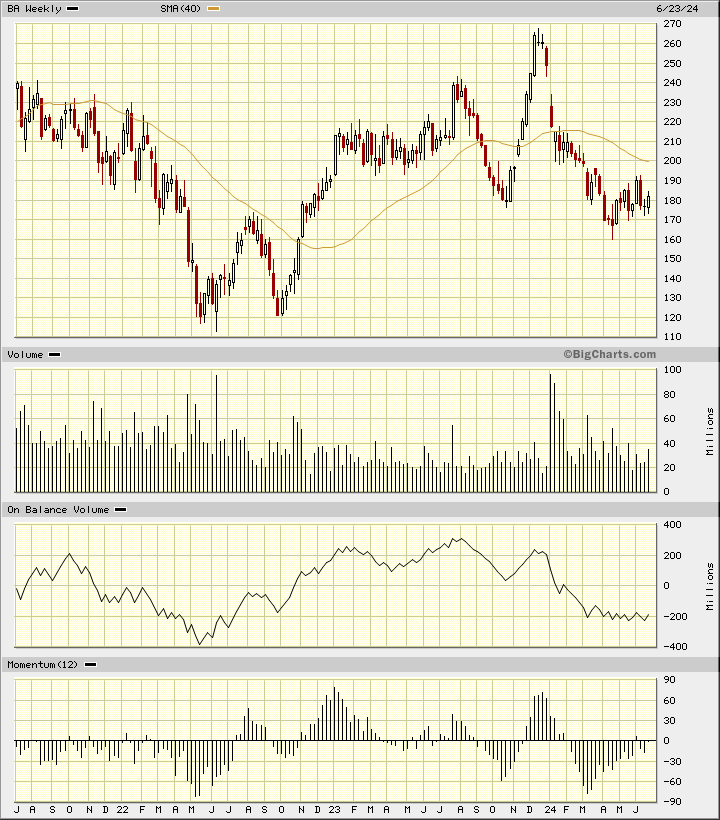
In this weekly Japanese candlestick chart of BA, below, I see a mixed picture. Prices are trading below the declining 40-week moving average line but I can also see a number of lower shadows on the candles the past three months. Trading volume has been active since the beginning of the calendar year. The weekly OBV line has been depressed the past four months. The 12-week momentum study shows us higher lows the past four months.
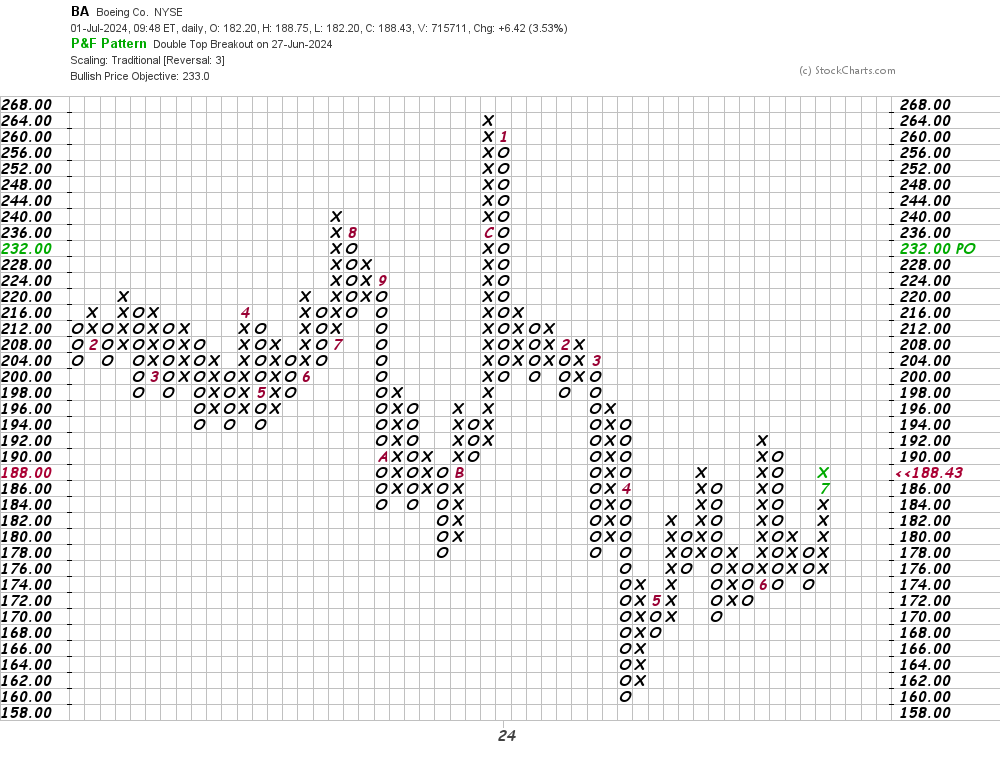
In this daily Point and Figure chart of BA, below, the software is showing us a potential upside price target in the $233 area.
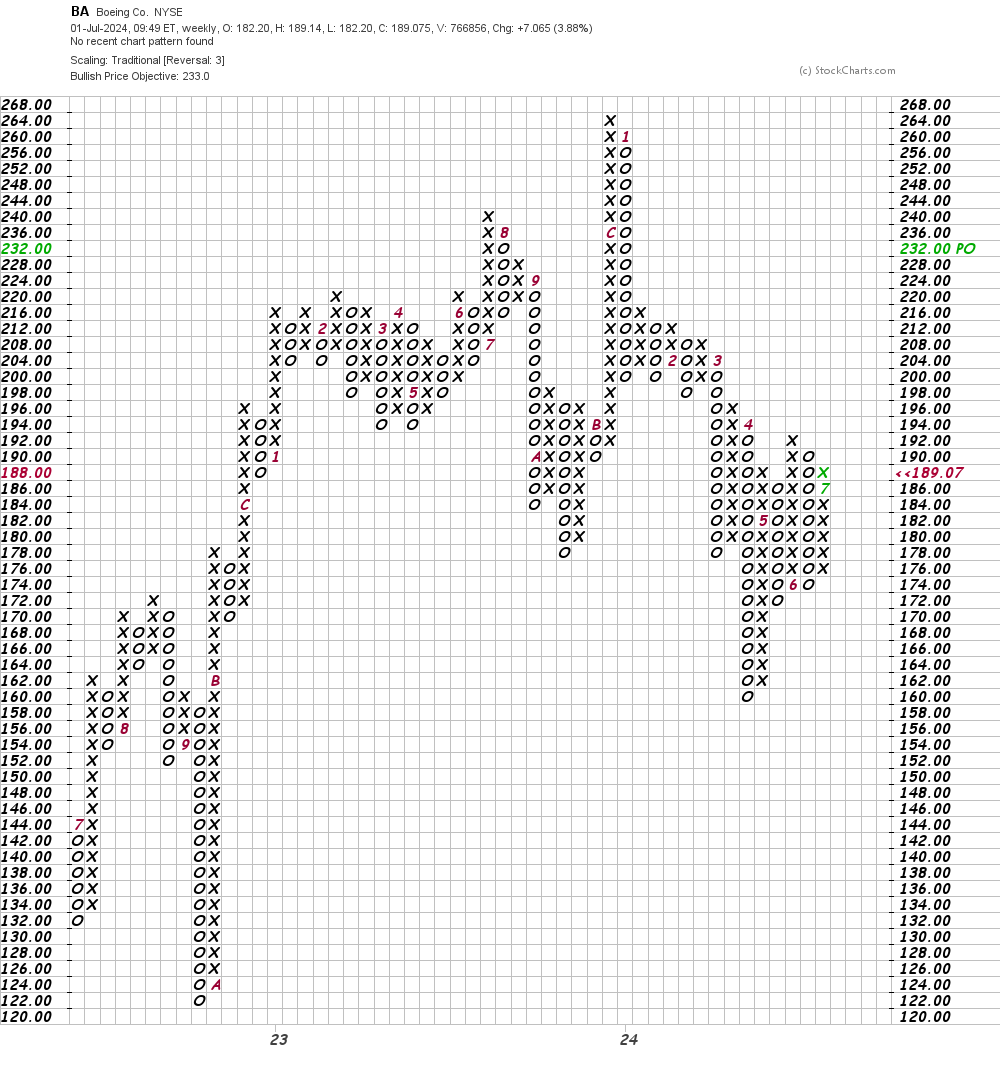
In this weekly Point and Figure chart of BA, below, I can see that the software is currently projecting the same $233 price target as the daily chart above.
Bottom line strategy: The four charts of BA above are looking a little better but they are "not out of the woods." (Keep your seat belts on low and tight.)
Employees of TheStreet are prohibited from trading individual securities.