As Nucor Continues to Drop, Can the Steelmaker's Stock Forge a Rebound?
Shares have declined sharply since mid-April. Let's check the charts and indicators for guidance.
You've reached your free article limit
You've read 0 of 1 free Pro articles.
Shares of steelmaker Nucor NUE are declining Friday after guiding second-quarter earnings well below year-ago numbers. The company is a producer of merchant bar and rebar, engineered bar, structural steel, carbon steel plate, and sheet steel products and technologies.
Let's check out the charts and indicators.
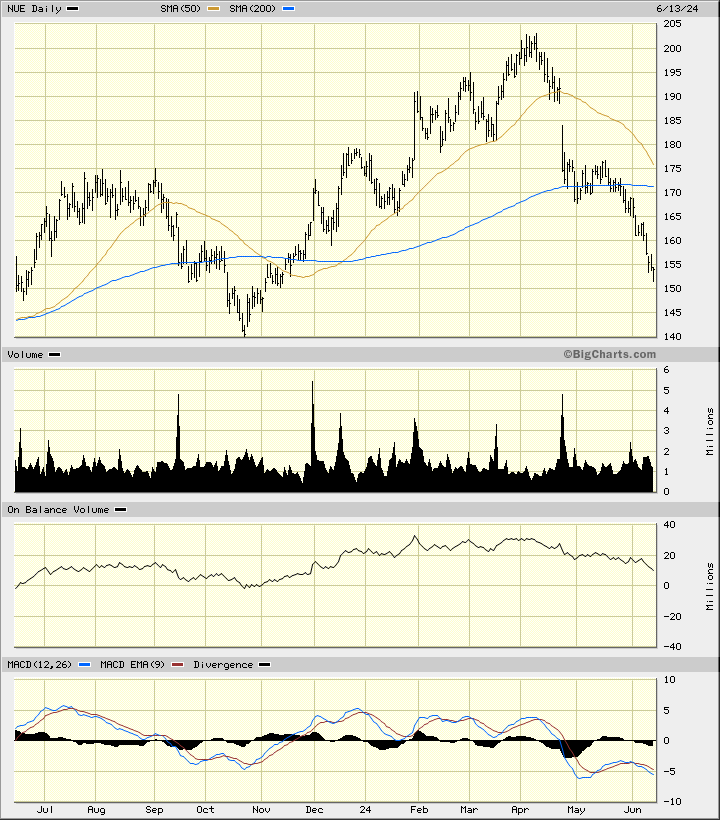
In the daily bar chart of NUE, below, I can see that the shares turned lower in the middle of April. I can see a gap lower in late April where prices gapped below the 50-day moving average line and continued down to the 200-day moving average line. NUE continued lower and now trades below the declining 50-day and the declining 200-day moving average line.
The On-Balance-Volume (OBV) line shows us weakness since the beginning of April and tells me that sellers of NUE are more aggressive than buyers of the stock. The Moving Average Convergence Divergence (MACD) oscillator has been bearish since late April.
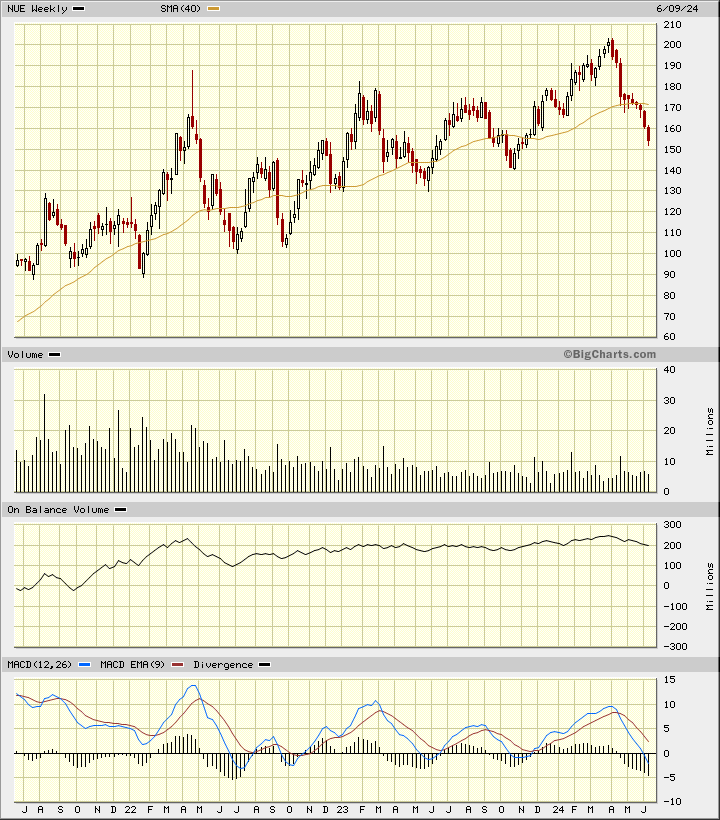
In the weekly Japanese candlestick chart of NUE, below, I can see that the shares are testing/breaking a three-year uptrend. The shares trade below the cresting 40-week moving average line.
The weekly OBV shows weakness the past three months. The MACD oscillator is pointed down towards the zero line and we could get a bearish cross of the line in the weeks ahead.
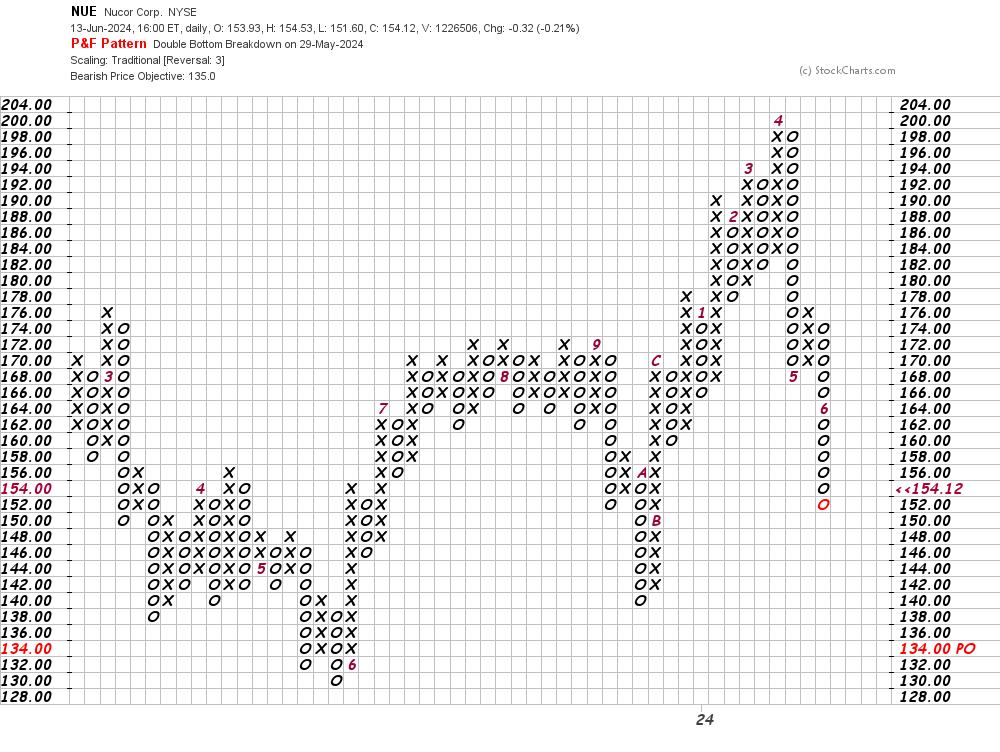
In this daily Point and Figure chart of NUE, below, I can see that the software is projecting the $135 area as a potential downside price target.
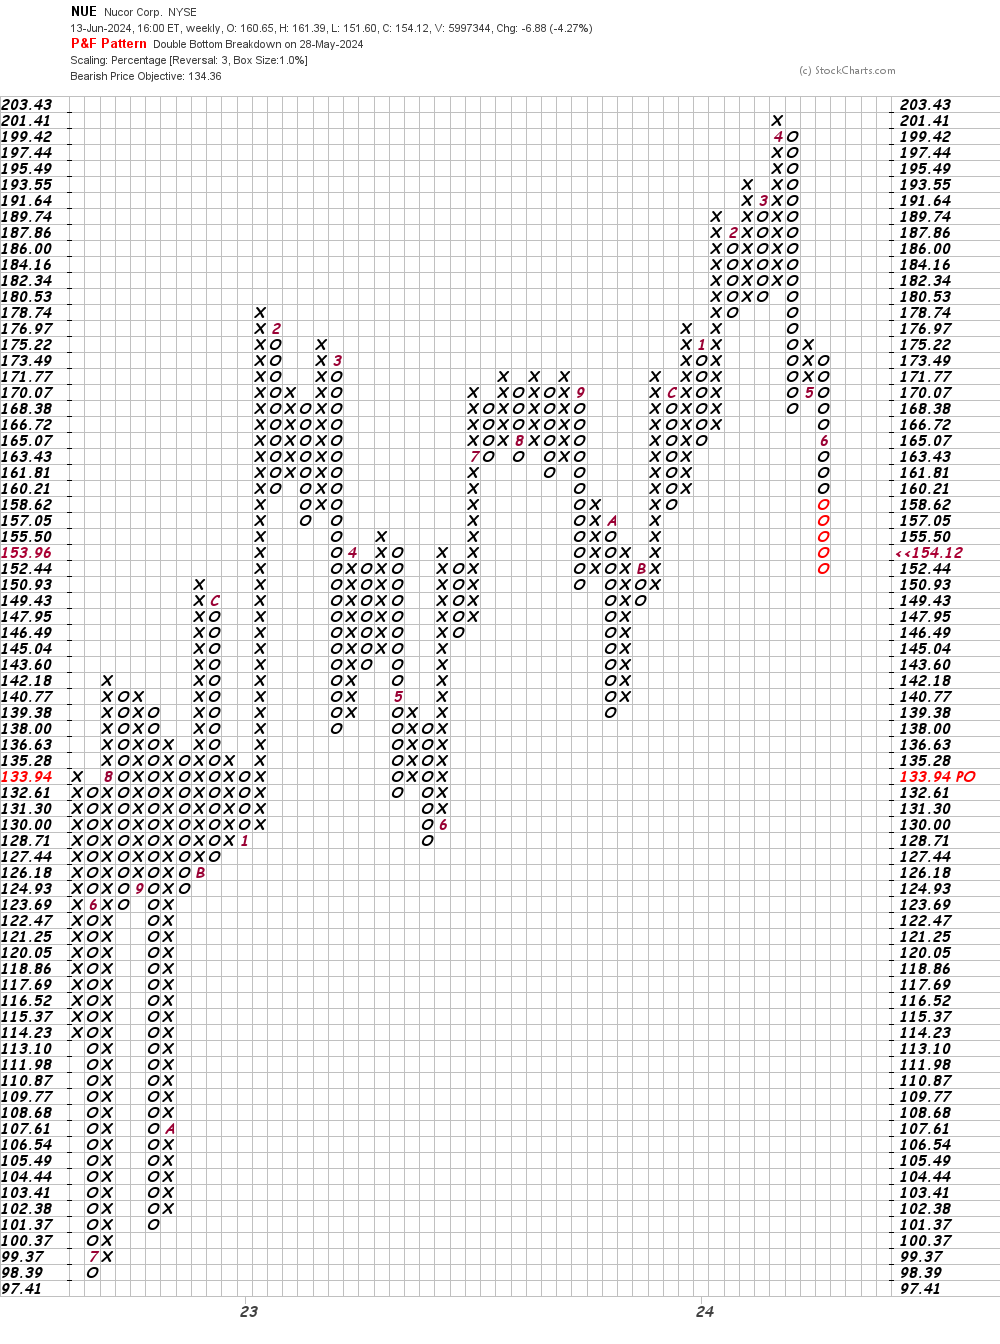
In this weekly Point and Figure chart of NUE, below, I can see a slightly lower price target in the $134 area.
Bottom-line strategy: NUE has dropped sharply since the middle of April. Further declines are likely. Avoid the long side of NUE for now.
Employees of TheStreet are prohibited from trading individual securities.