As CEO Exits FIVE, Look Out Below!
Shares are moving lower and investors are getting discount prices where they don't want them.
You've reached your free article limit
You've read 0 of 1 free Pro articles.
Shares of discount retailer Five Below FIVE are trading sharply lower in the pre-market Wednesday, as investors react to the company's CEO change and fresh guidance. Five Below named Kenneth Bull as the CEO and interim president after the current president stepped down. The company noted that customers continue to deal with the higher cost from inflation.
Let's check out the charts and indicators.
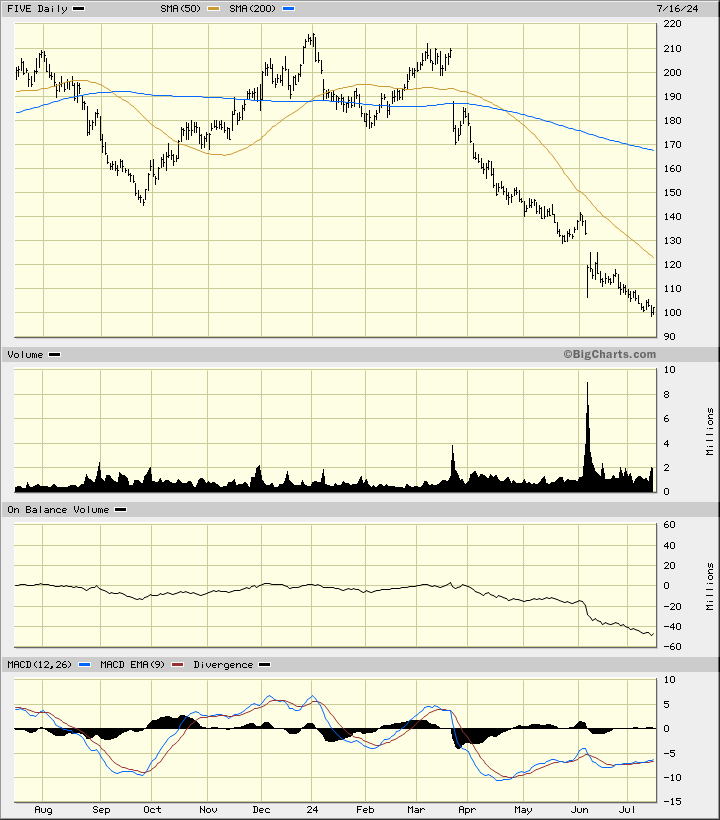
In this daily bar chart of FIVE, below, I can see that prices have been in a downward trend since March. Prices have been trading below the negatively sloped 50-day moving average line and below the declining 200-day line.
The On-Balance-Volume (OBV) line shows weakness since March and the trading volume has increased telling me that traders are voting with their feet and liquidating positions. The trend-following Moving Average Convergence Divergence (MACD) oscillator has been weakening since January and remains below the zero-line in sell territory. Prices are set to open with a gap lower if the pre-market weakness continues.
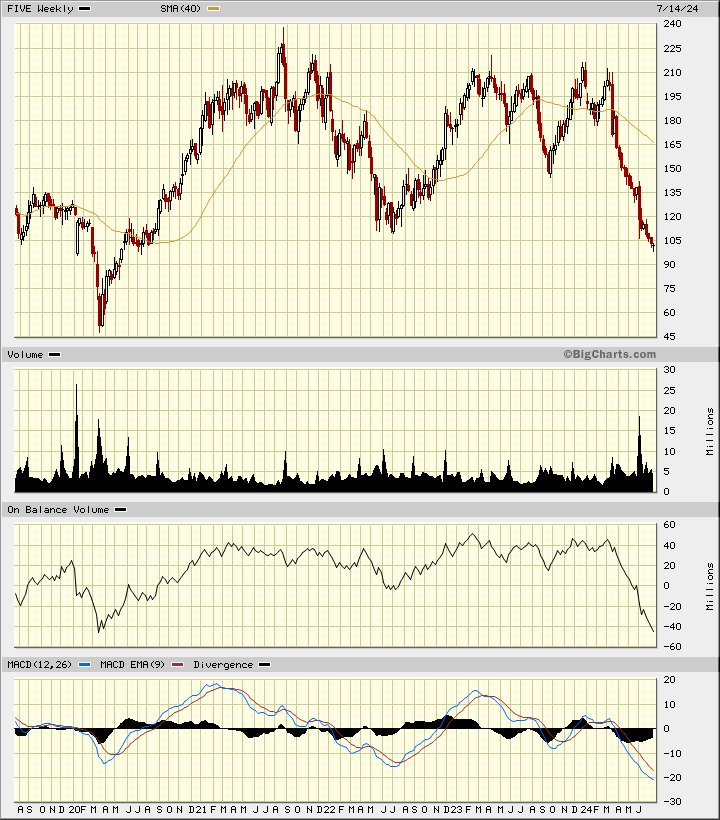
In this weekly Japanese candlestick chart of FIVE, below, I went back five years to get some perspective on the price decline. Prices are heading down towards the lows of 2020. Prices trade below the declining 40-week moving average line. The weekly OBV line and the MACD oscillator are both bearish. The bears are in control.
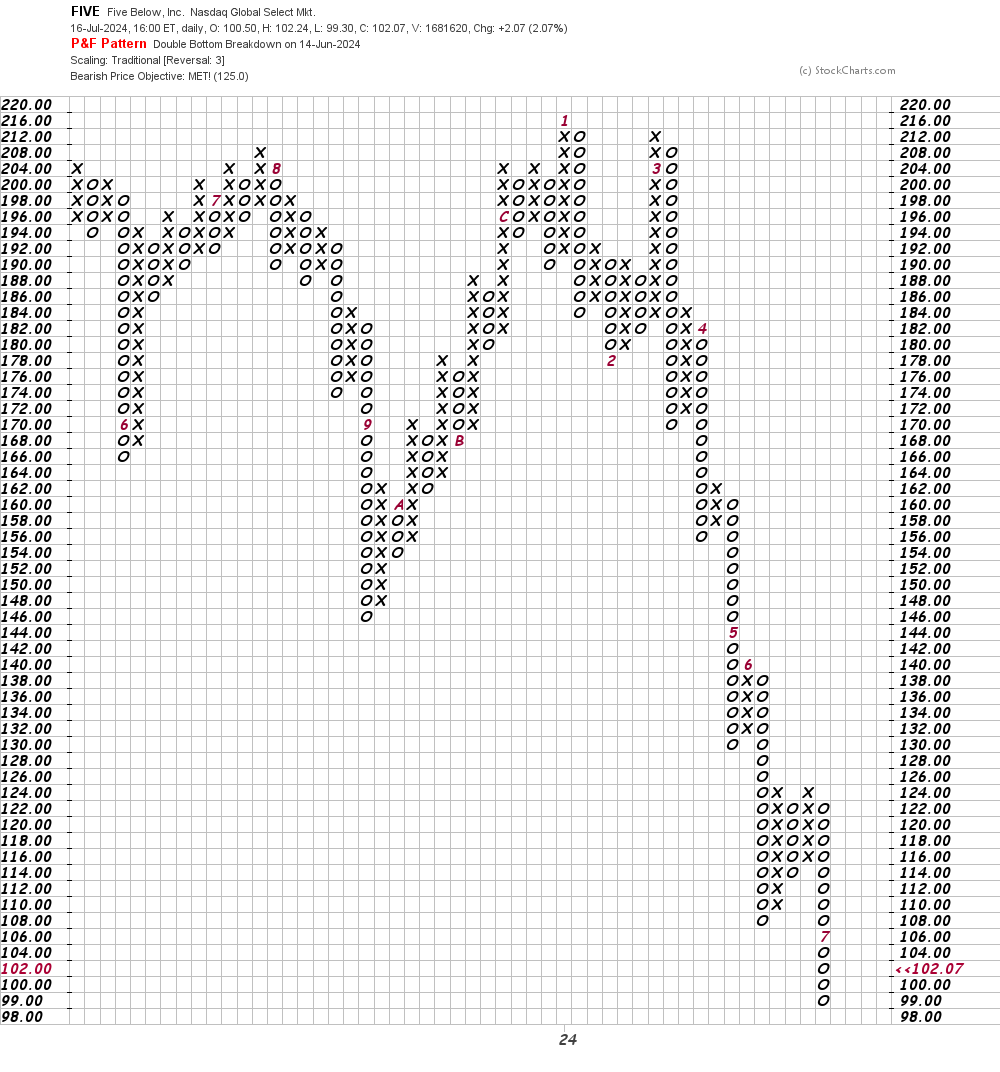
In this daily Point and Figure chart of FIVE, below, I can see that prices have reached and exceeded a downside price target in the $125 area.
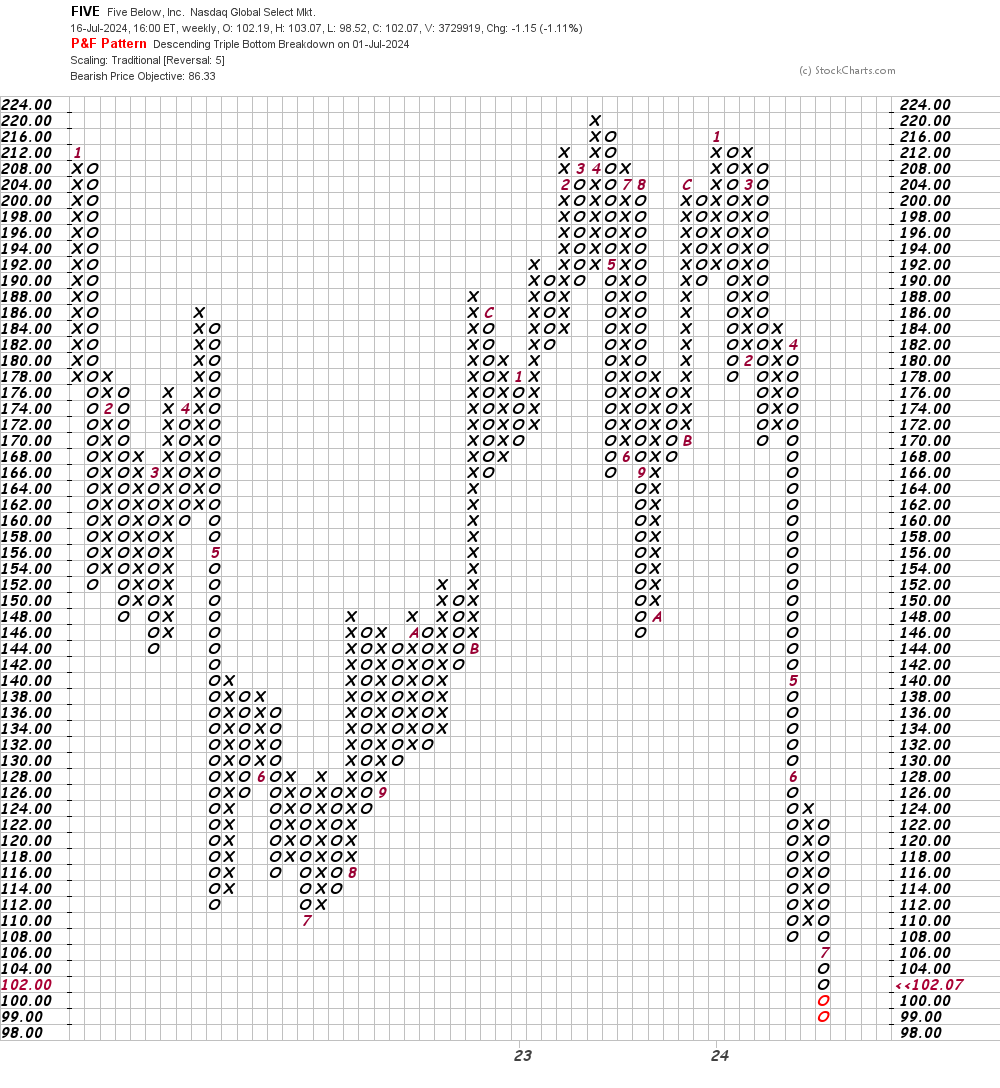
In this weekly Point and Figure chart of FIVE, below, I used a five box reversal filter. Here the software suggests a downside price target in the $86 area.
Bottom line strategy: Do not fight the tape and get tempted to buy the dip (or the plunge) in FIVE.
Employees of TheStreet are prohibited from trading individual securities.