Arm Holdings: Look Out for a Possible Washout
The stock is breaking a support level.
You've reached your free article limit
You've read 0 of 1 free Pro articles.
In my April 10 review of the charts of Arm Holdings ARM, I wrote that "Arm Holdings plc continues to test the $120 level on the charts while the indicators weaken. A break to the downside could be coming soon."
And here we are.
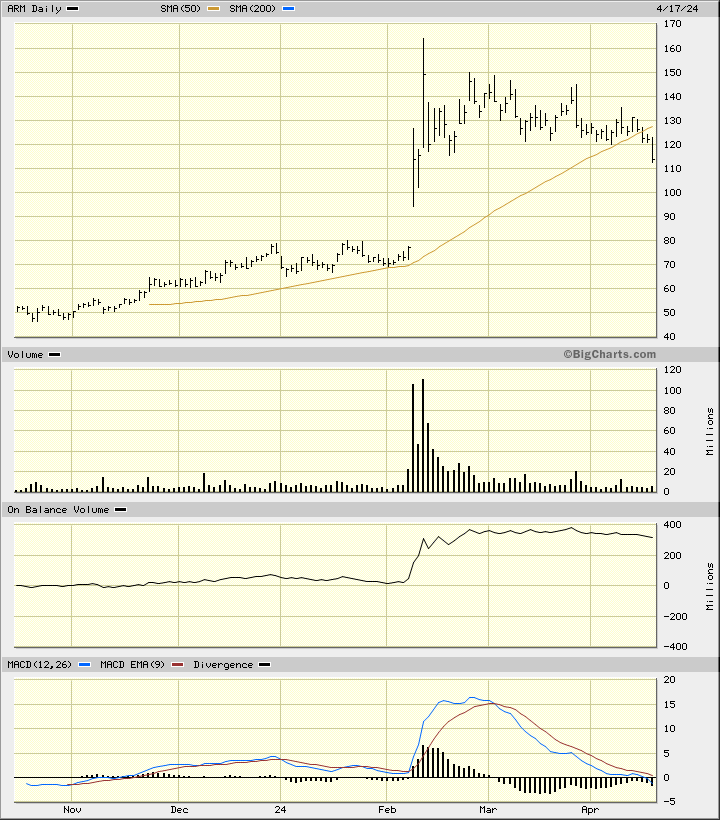
In this updated daily bar chart of ARM, below, I can see that prices are trading below the $120 level where prices had been finding buying interest (support). Prices are also trading below the cresting 50-day moving average line.
The daily On-Balance-Volume (OBV) line has been edging lower the past four weeks indicating a shift from aggressive buying to aggressive selling.
The Moving Average Convergence Divergence (MACD) oscillator has weakened the past two months and is now crossing below the zero line for an outright sell signal.
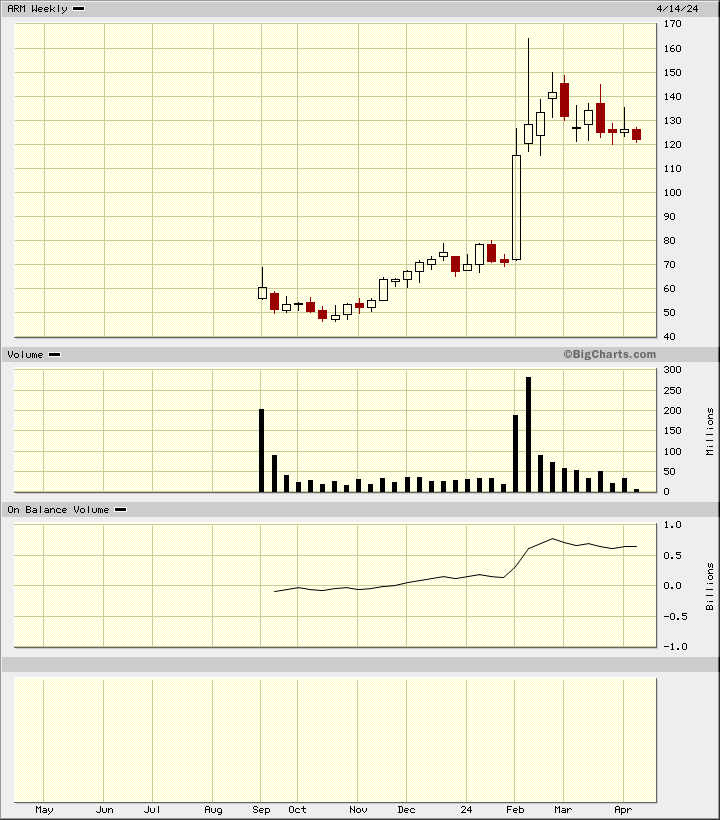
In this weekly Japanese candlestick chart of ARM, below, we have to imagine that prices are trading below $120 as this chart does not update until Friday. Prices may decline to the middle of the large white real body in early February in the $95 area.
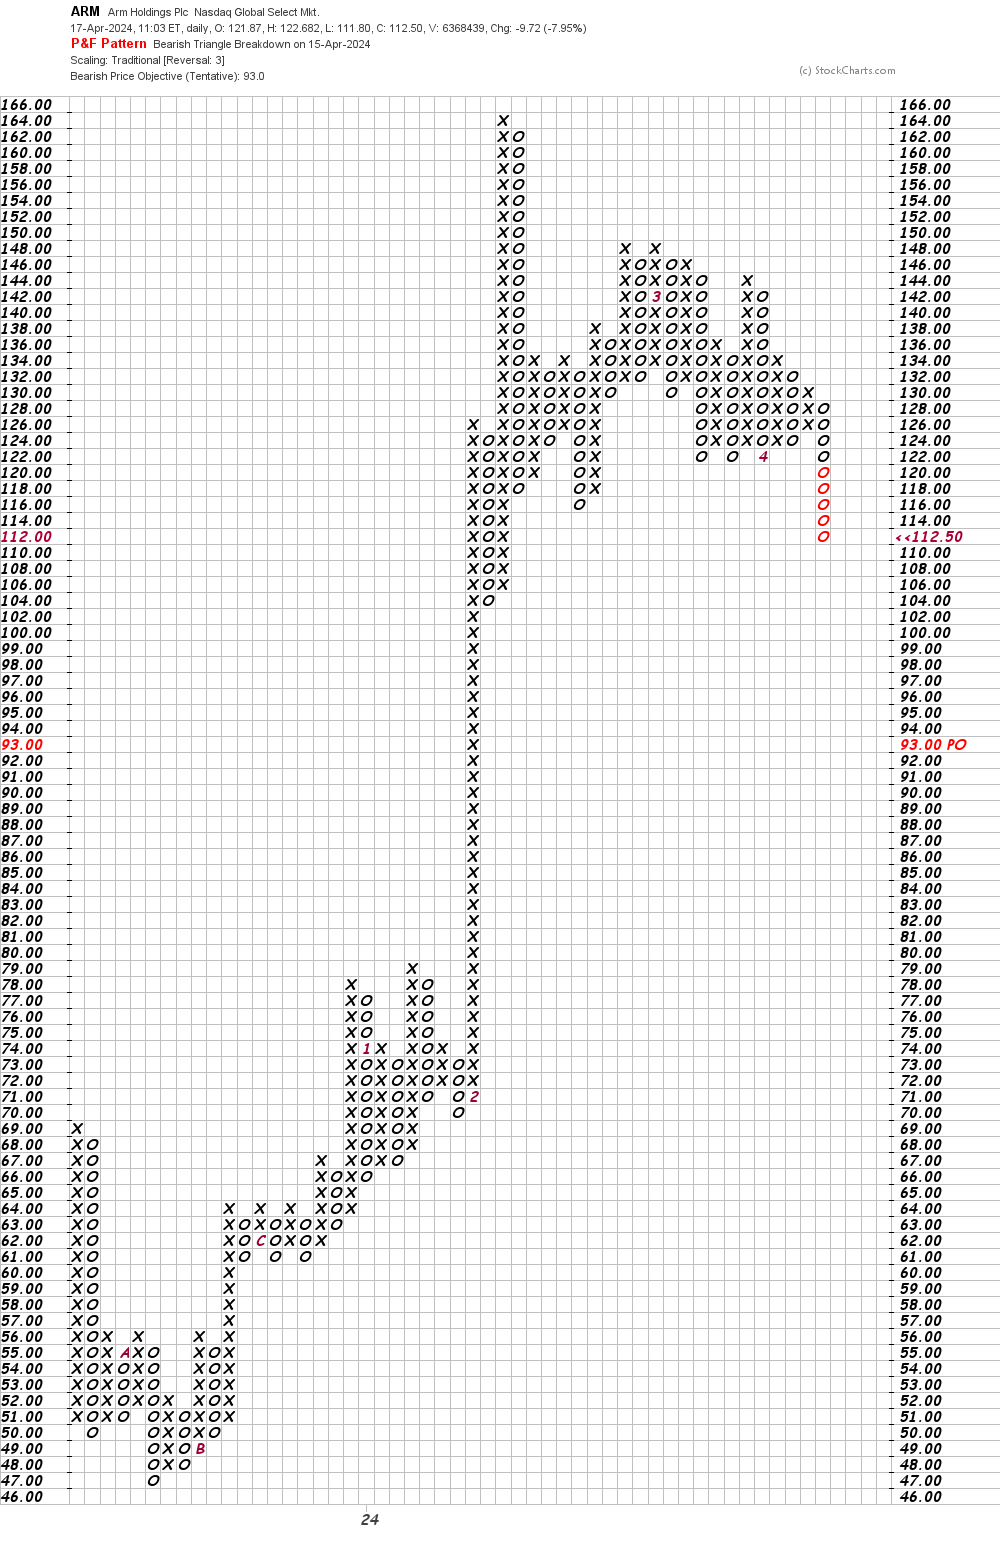
In this daily Point and Figure chart of ARM, below, I can see a potential downside price target in the $93 area.
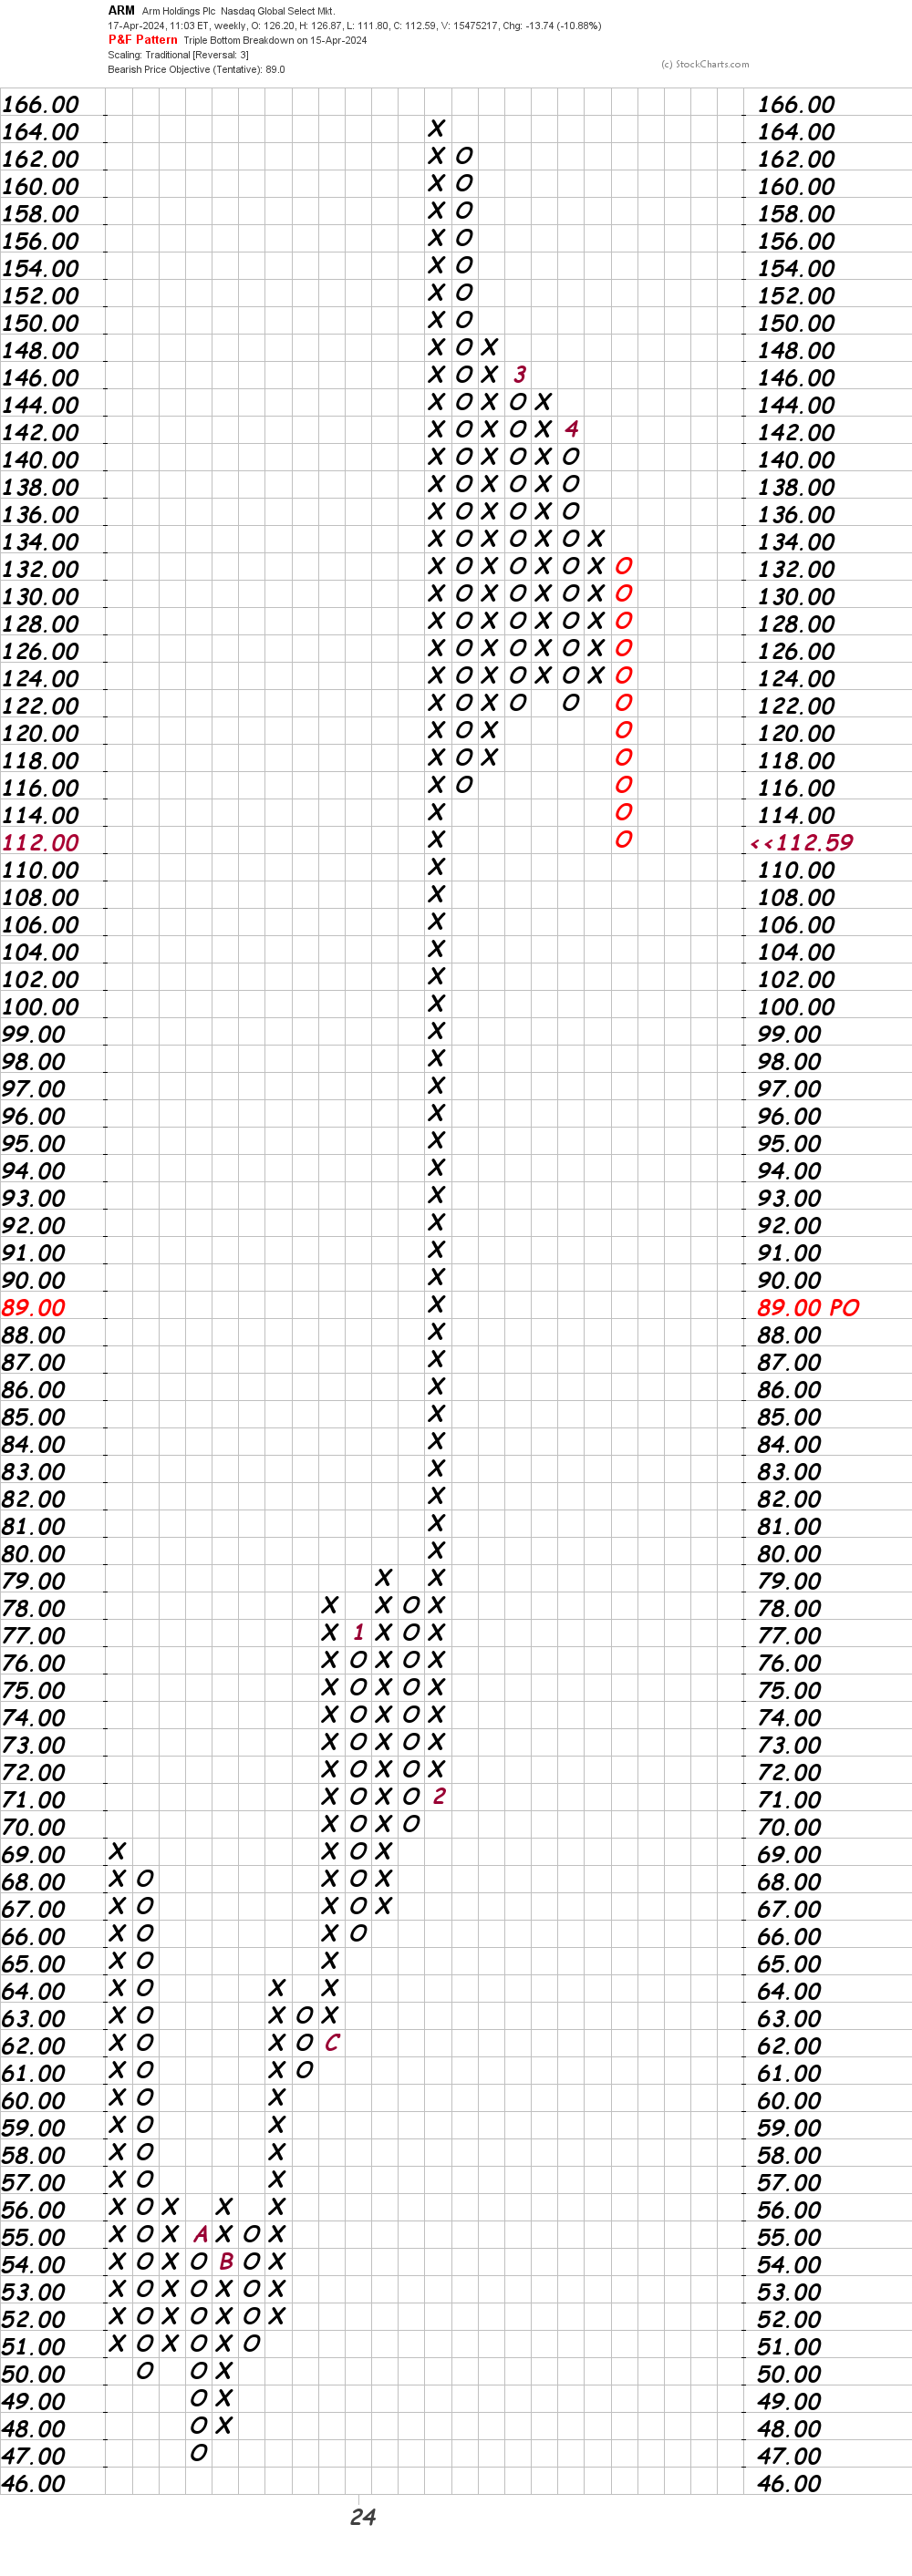
In this weekly Point and Figure chart of ARM, below, I can see a price target in the $89 area.
Bottom line strategy: Avoid the long side of ARM as a "washout" to the $75 area is possible in the weeks ahead.
Employees of TheStreet are prohibited from trading individual securities.