Arm Holdings Is on a Downward Slope
Arm buyers and sellers are balanced but starting to weaken.
You've reached your free article limit
You've read 0 of 1 free Pro articles.
Arm Holdings plc ARM continues to test the $120 level on the charts while the indicators weaken. A break to the downside could be coming soon.
Let's check the charts and indicators of this technology play.
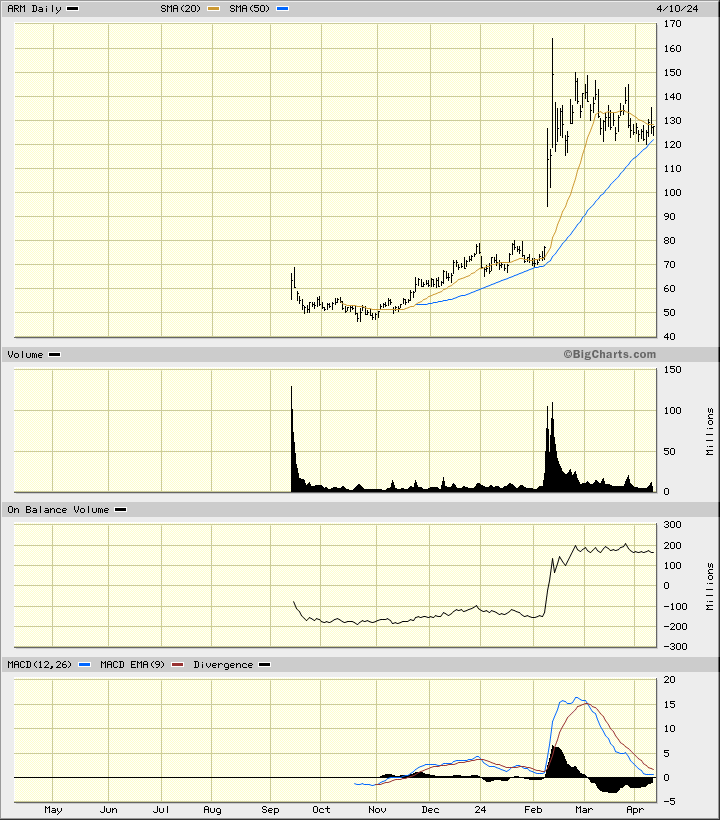
In this daily bar chart of ARM, below, I can see that prices have traded sideways since the early part of February. Prices are trading below the short-term 20-day moving average line and are testing the rising 50-day moving average line. The daily trading volume histogram shows that volume has dried up over the past six weeks or so.
The daily On-Balance-Volume (OBV) line has moved sideways to a touch lower in the past six weeks and tells me that buyers and sellers of ARM are balanced but starting to weaken. The Moving Average Convergence Divergence (MACD) oscillator has weakened since the beginning of March and is now close to moving below the zero line.
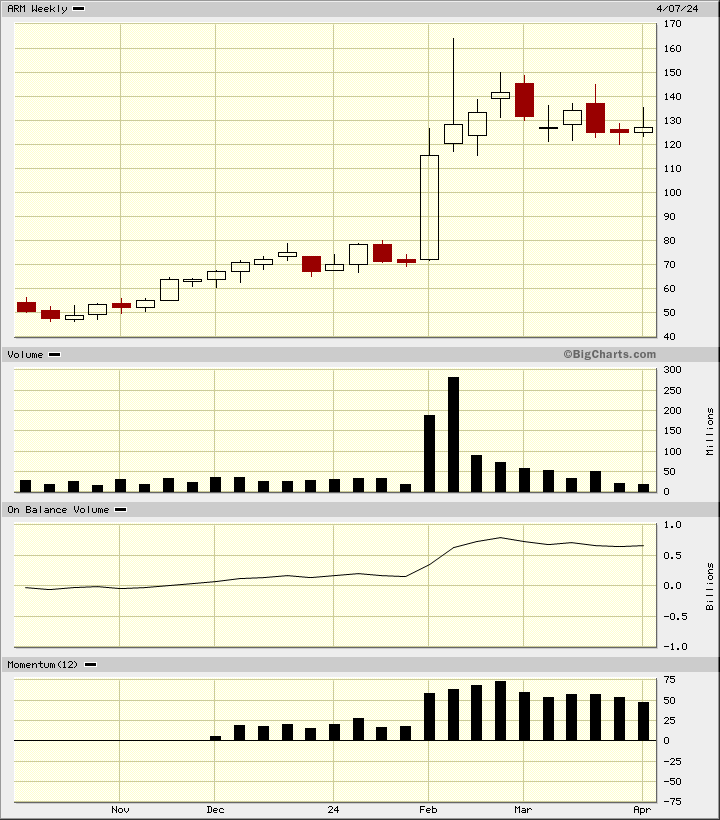
In this weekly Japanese candlestick chart of ARM, below, I can see a small parade of weak-looking candles the past nine weeks. It starts with a large upper shadow and continues with a number of spinning tops and more upper shadows. Momentum has been weakening so a close below $120 is likely to precipitate further declines.
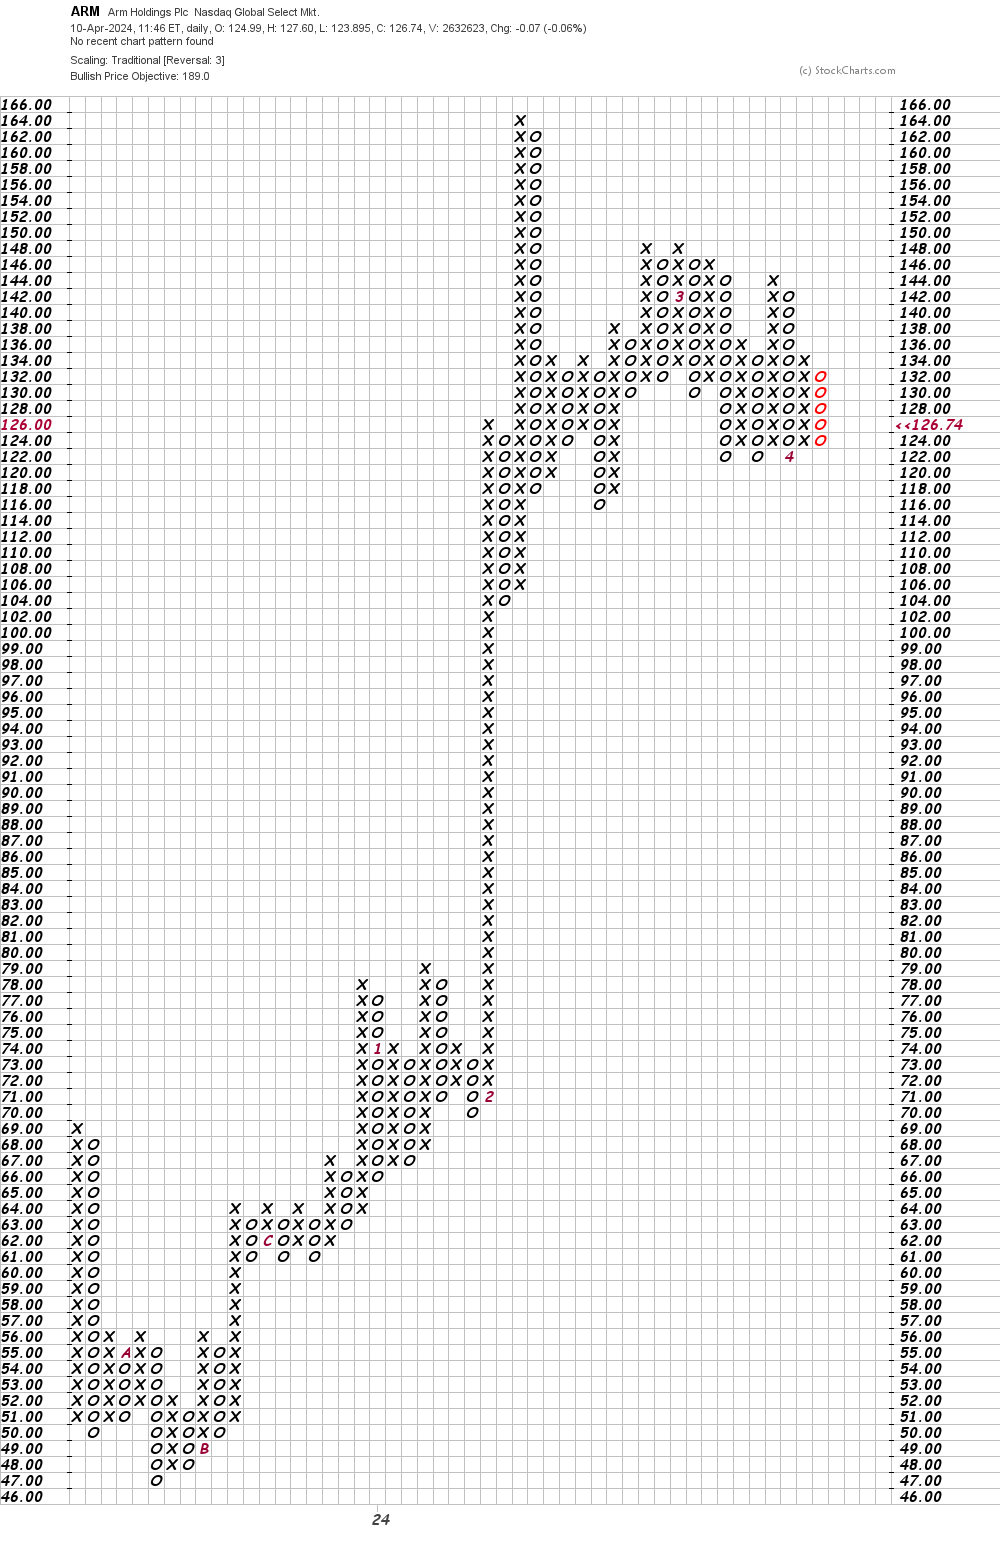
In this daily Point and Figure chart of ARM, below, I can see a potential upside price target in the $189 area but a trade at $120 or $118 could tilt this chart in favor of the bears.
Bottom line strategy: Traders should avoid the long side of ARM as the odds of a decline look more likely now.
Employees of TheStreet are prohibited from trading individual securities.