Abercrombie & Fitch Poised for Major Surge With New Price Target
This retailer has the potential to return over 50%.
You've reached your free article limit
You've read 0 of 1 free Pro articles.
On November 21, Sarge recapped his investment thesis on SoFi SOFI shares and introduced MarketGrader, a new service that we’re trying out.
MarketGrader can best be thought of as a Quant platform with a GARP methodology. I like GARP, too, because it helps find the best combination of stocks that are growing but not overpriced.
So, I thought I would share a stock idea I’ve been looking at based on both my methodology and MarketGrader’s.
I’m a top-down investor. I like starting with the forest and working my way toward the trees. In other words, start with the asset class, then the sector, and then the security.
There’s little argument that stocks are presently in a bull market, albeit one that’s more than a little long in the tooth. In fact, I think that any new investments here are high risk. So, stop-loss orders are important.
Hold your nose and buy.
But where? Which sectors are attractive?
I like Comparative Relative Strength charts. These charts are a ratio of the price of the sector vs. the S&P 500. Upwards sloping lines indicate outperformance. Downwards sloping lines indicate underperformance.
Here’s a grid of the nine original Sector SPDRs vs. the S&P 500. It’s a five-year view, so you can see how tech XLK has been winning at the expense of everything else. But there’s been some rotation recently into financials, industrials, utilities and cyclicals.
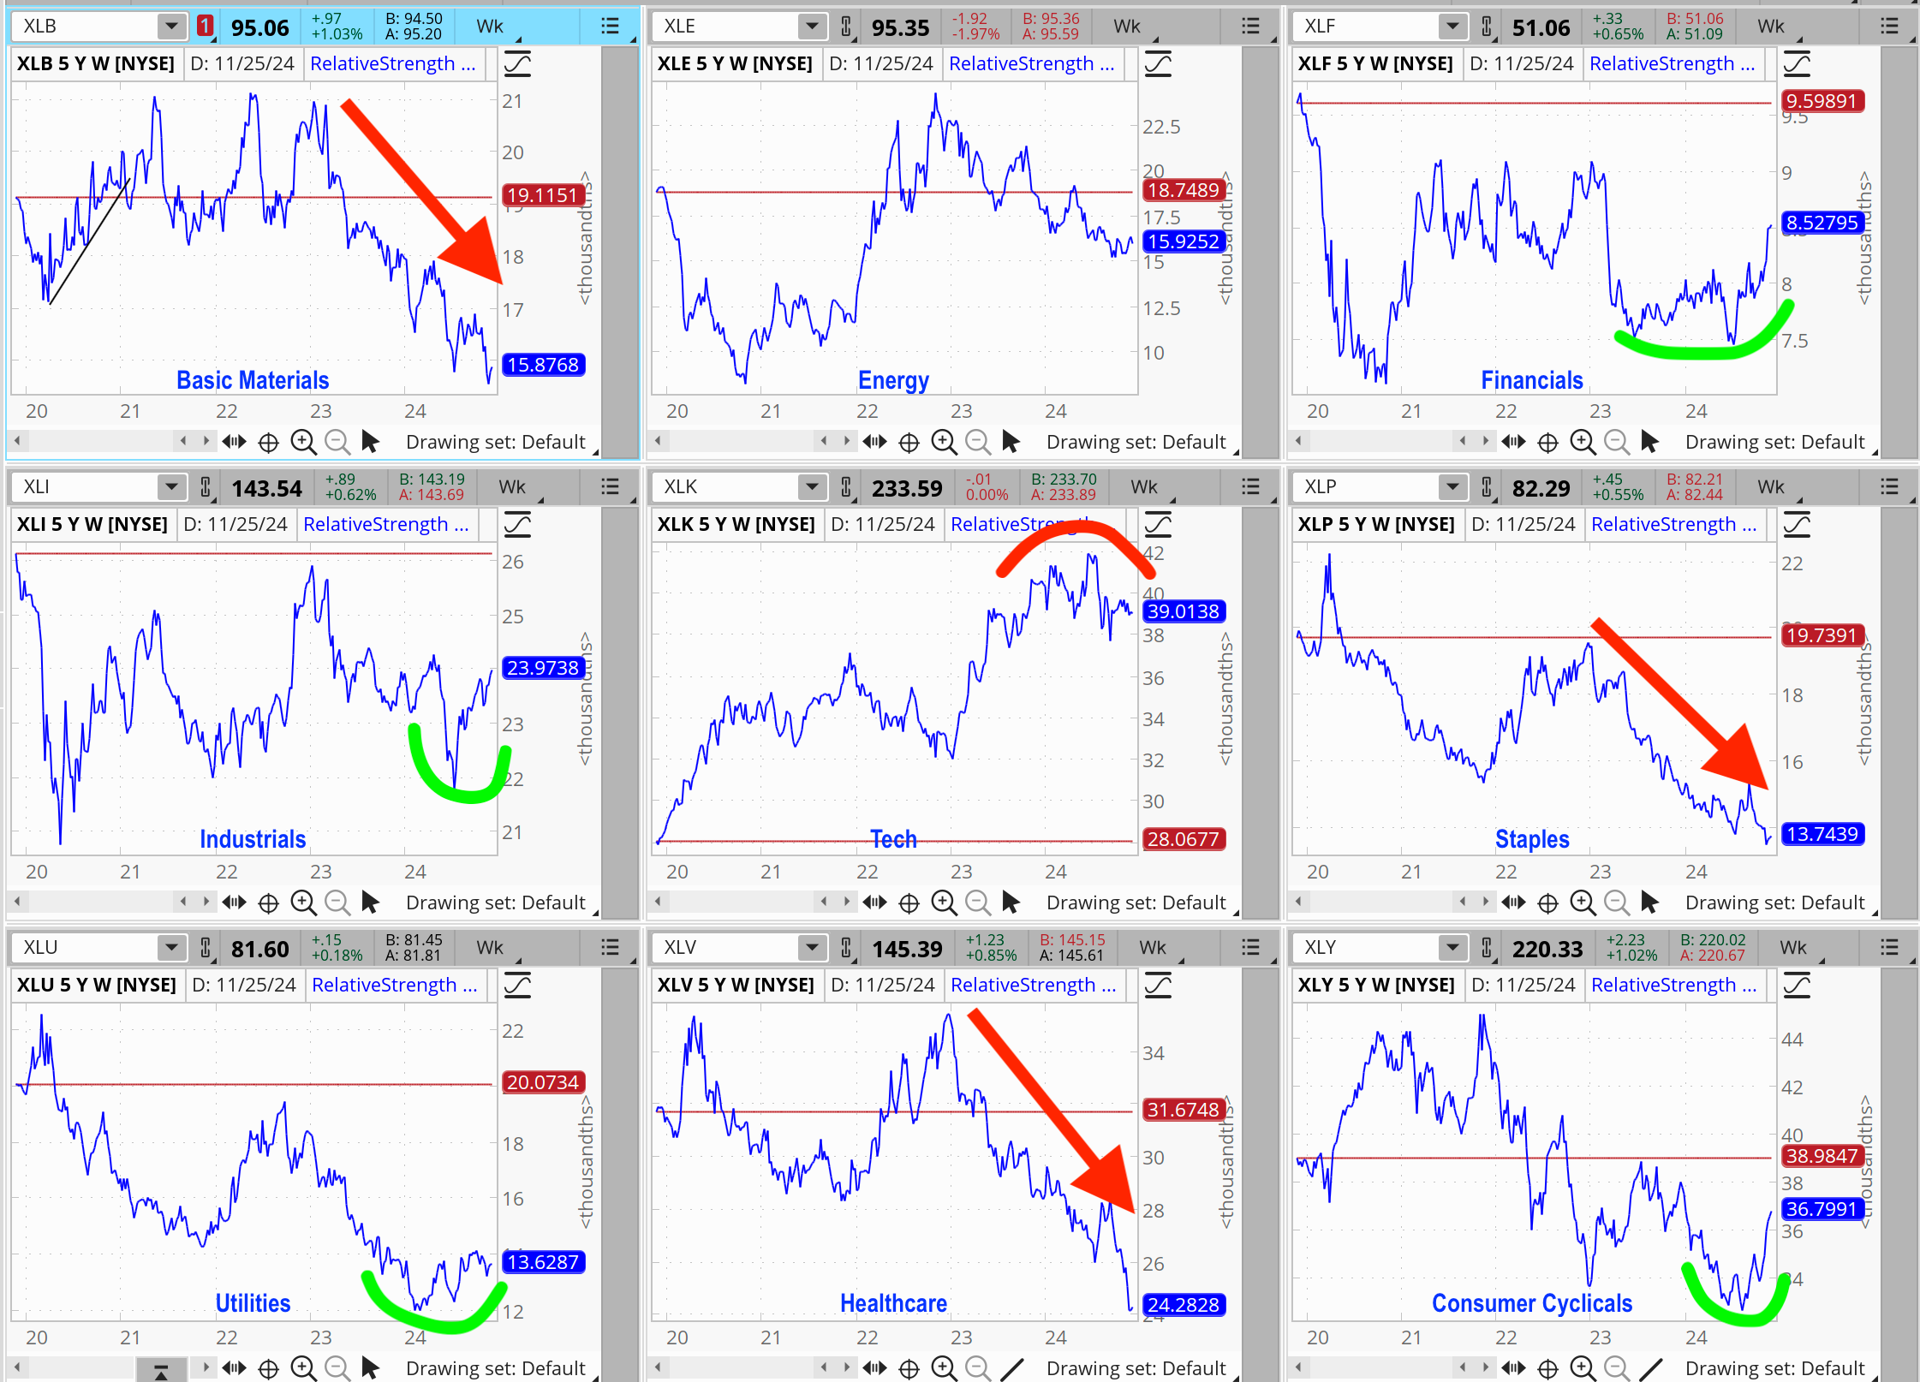
Utilities are more impressive than they look here. Remember, a good chunk of their return comes from dividends and this chart uses price only.
Let’s focus on cyclicals. They’ve been underperforming for much of the last five years but have had a nice run recently, up around 30% since the summer low. Is it sustainable? I don't know and will continue watching this chart to see if anything changes.
So, let’s find a stock in cyclicals that could be ready for a move higher. For this, I turned to MarketGrader and screened for stocks with an overall grade above 70 (buy rated), with a growth score also above 70.
Here’s the list:
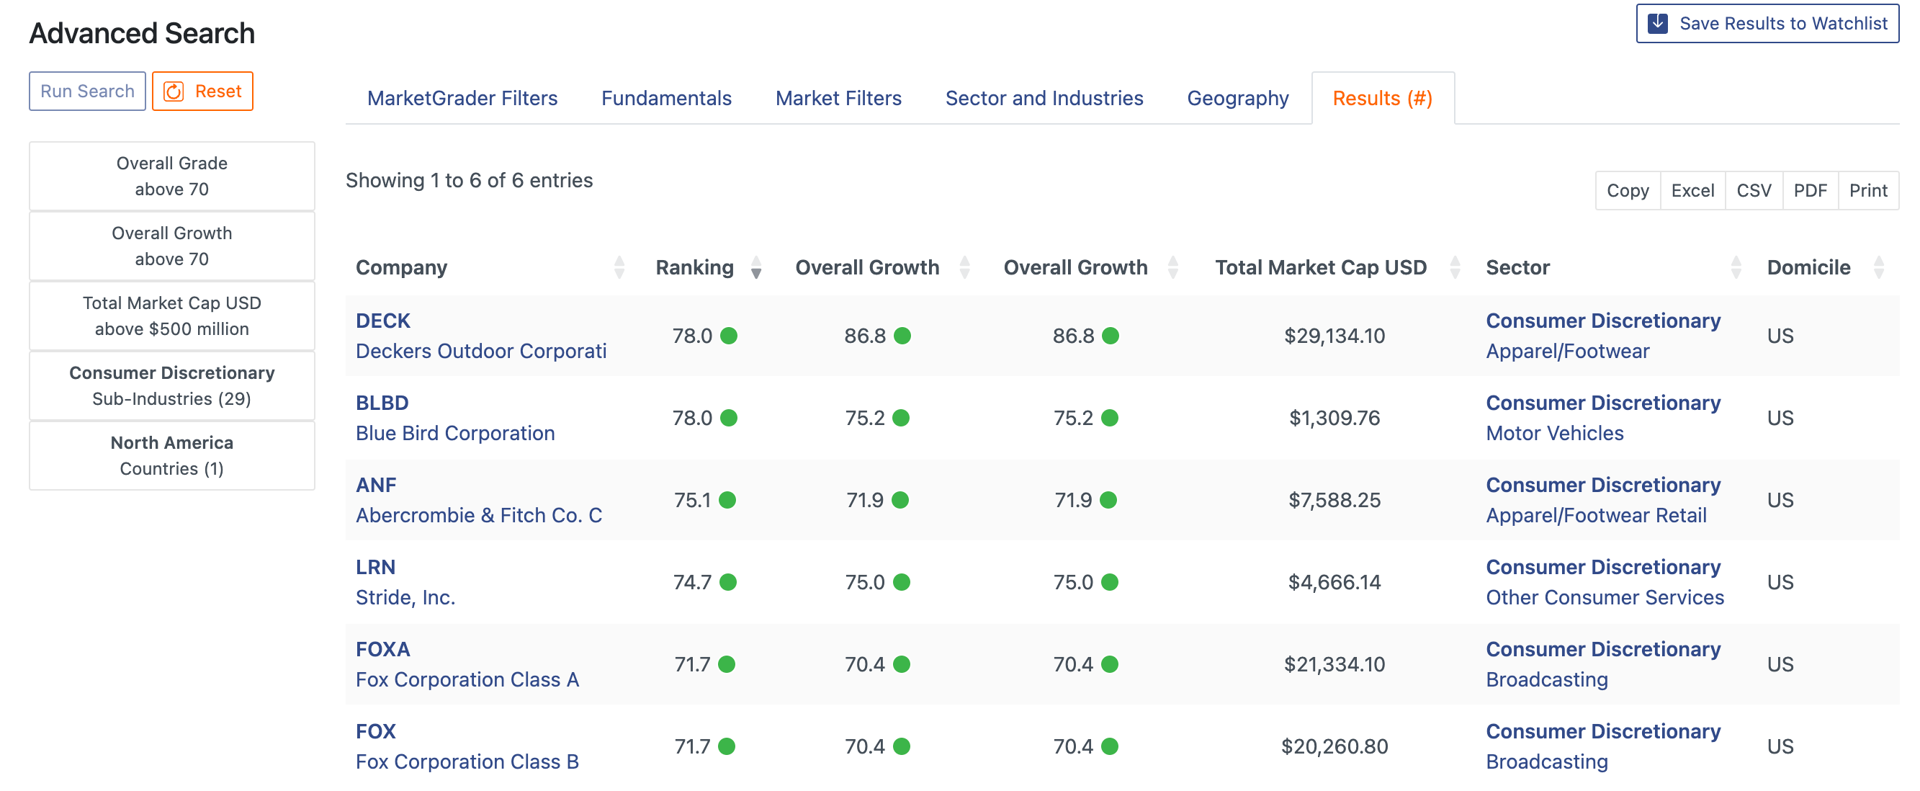
Essentially, I’m outsourcing the first pass at the fundamentals to MarketGrader.
The next filter I use is technicals.
Specifically, some of you know that I have studied trading volume and learned that when a stock has abnormally low relative volume, it’s ready for a move. I can’t forecast directionality using this method, but it’s a good way to find stocks that have been ignored.
Several of the stocks in this list had abnormally low normalized relative volume (my indicator), but Abercrombie & Fitch ANF was, until recently, the most abnormal.
Here’s a chart:
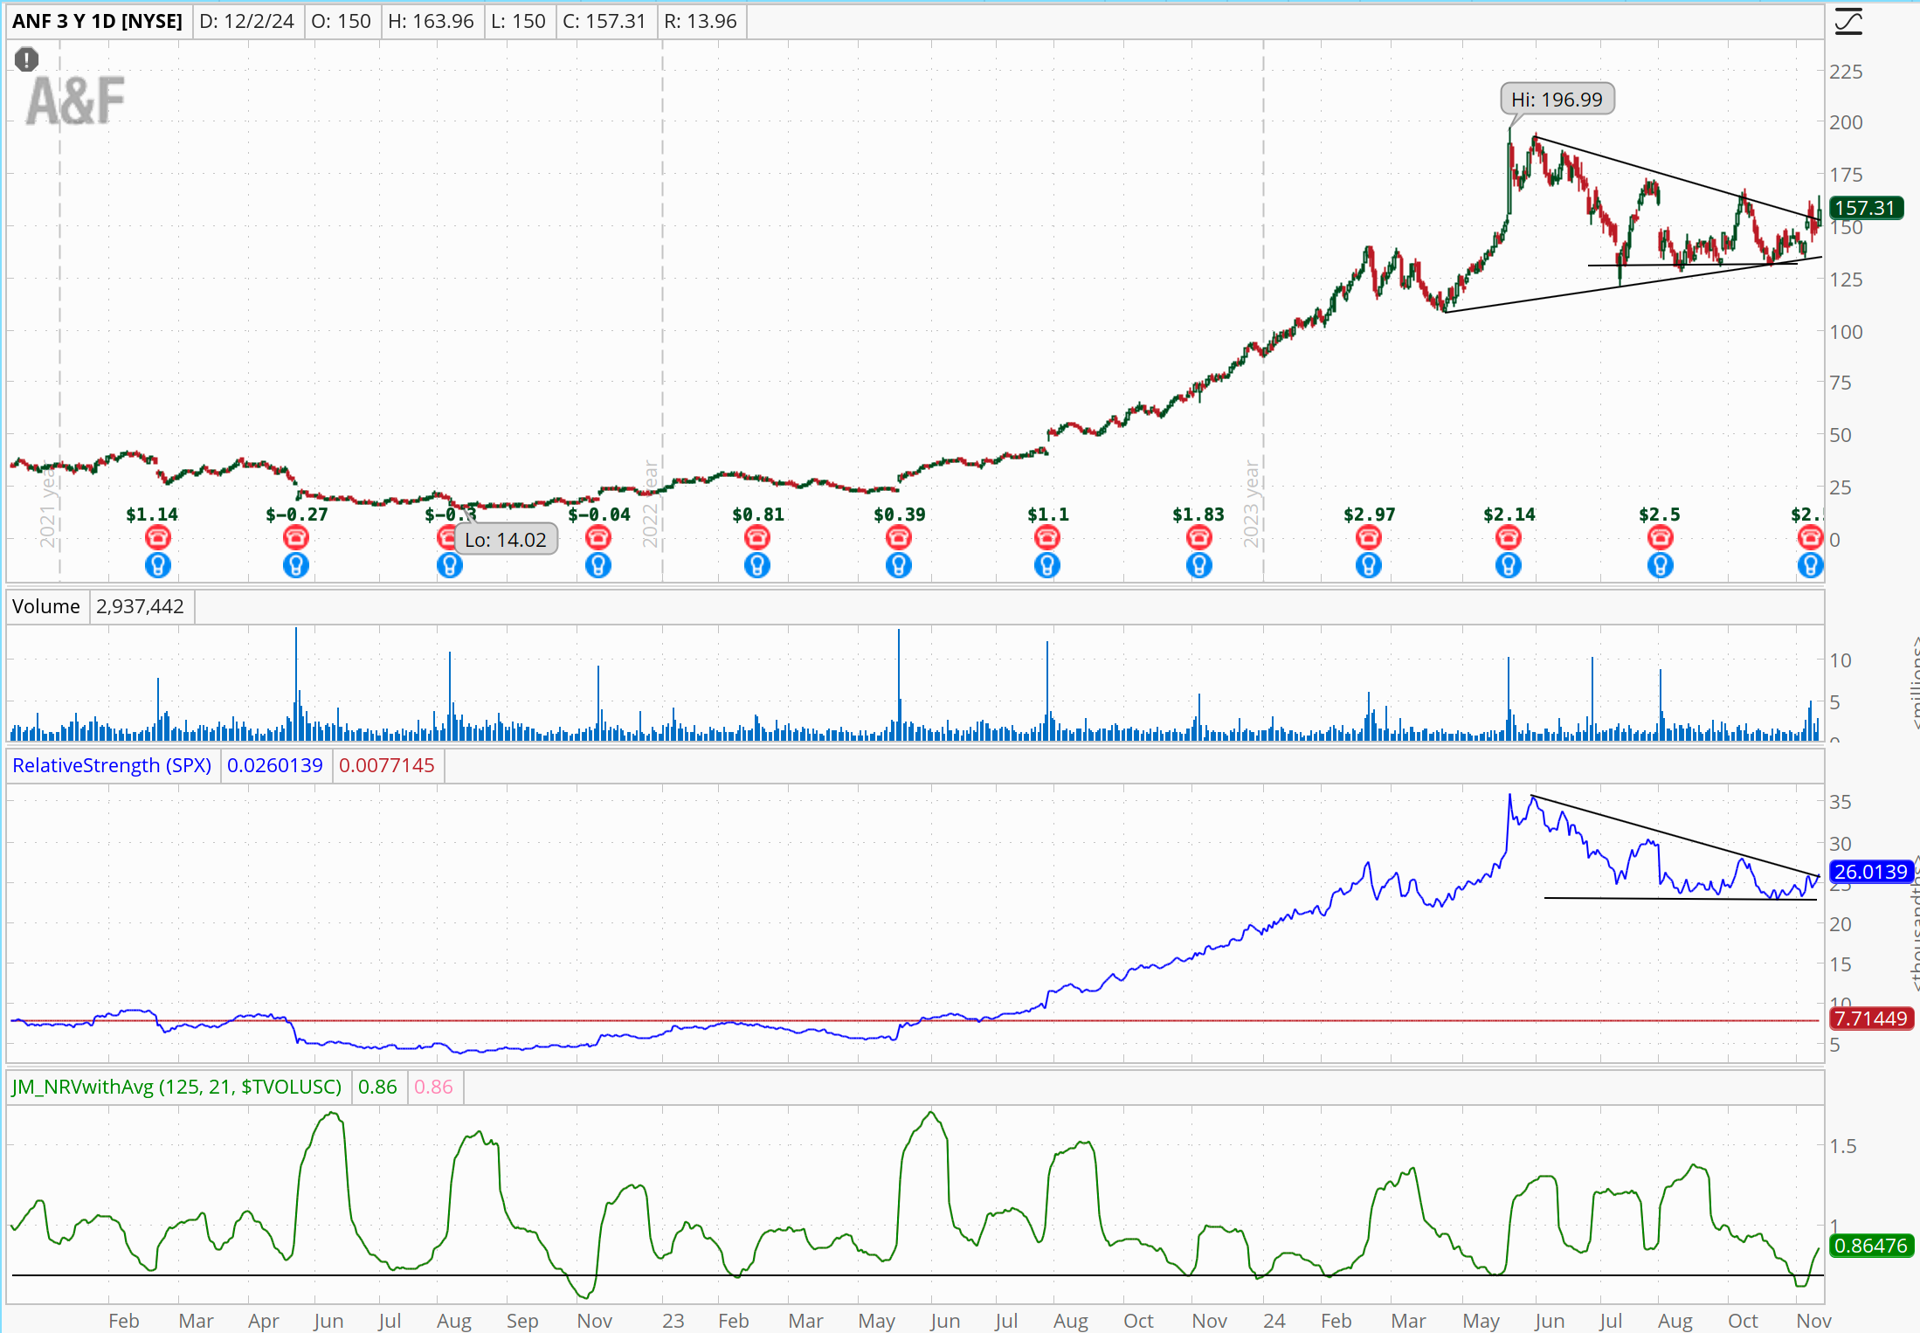
Technically, there are several things I like about it.
First, notice my lower indicator, JM_NRVwithAVG, that’s normalized relative volume-volume normalized against the market and history for the last 21 trading days. The only other time it was as low as it was last month was in 2022, and that preceded a 20% move higher. The stock has been off people’s radar, and they’ve only just started looking at it again following last week’s earnings report.
Second, the price pattern suggests a continuation of the uptrend. Shares have paused during 2024 and gone sideways within a large range. But they’ve coiled up to make a move, and broke out today. I target $210 to $240, based on the width of the pennant.
Third, the 14-day RSI (not shown) has a pattern of rising lows and the MoneyFlow has drifted upwards even as the stock has drifted down from the May high. Momentum is on our side.
Last, the middle panel shows the comparative relative strength versus the S&P 500. ANF’s relative performance contracted along with its price performance and has just broken out.
Fundamentally, MarketGrader has the stock rated Buy with a score of 75. The following factors contributing to its bullish rating:
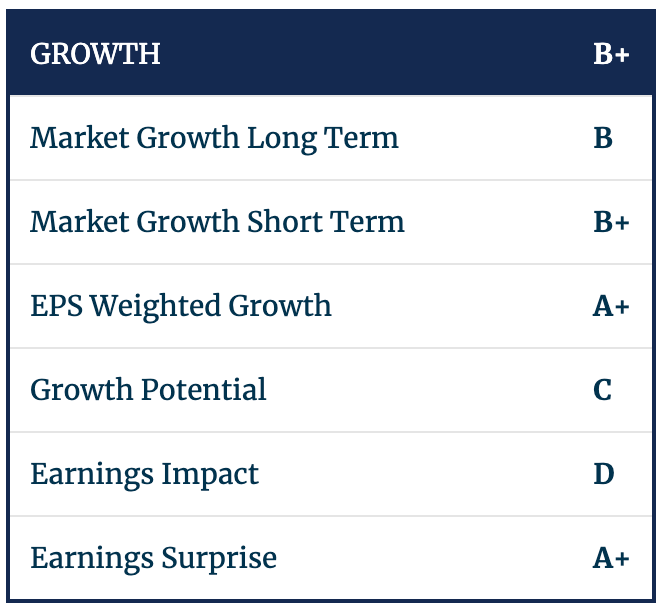
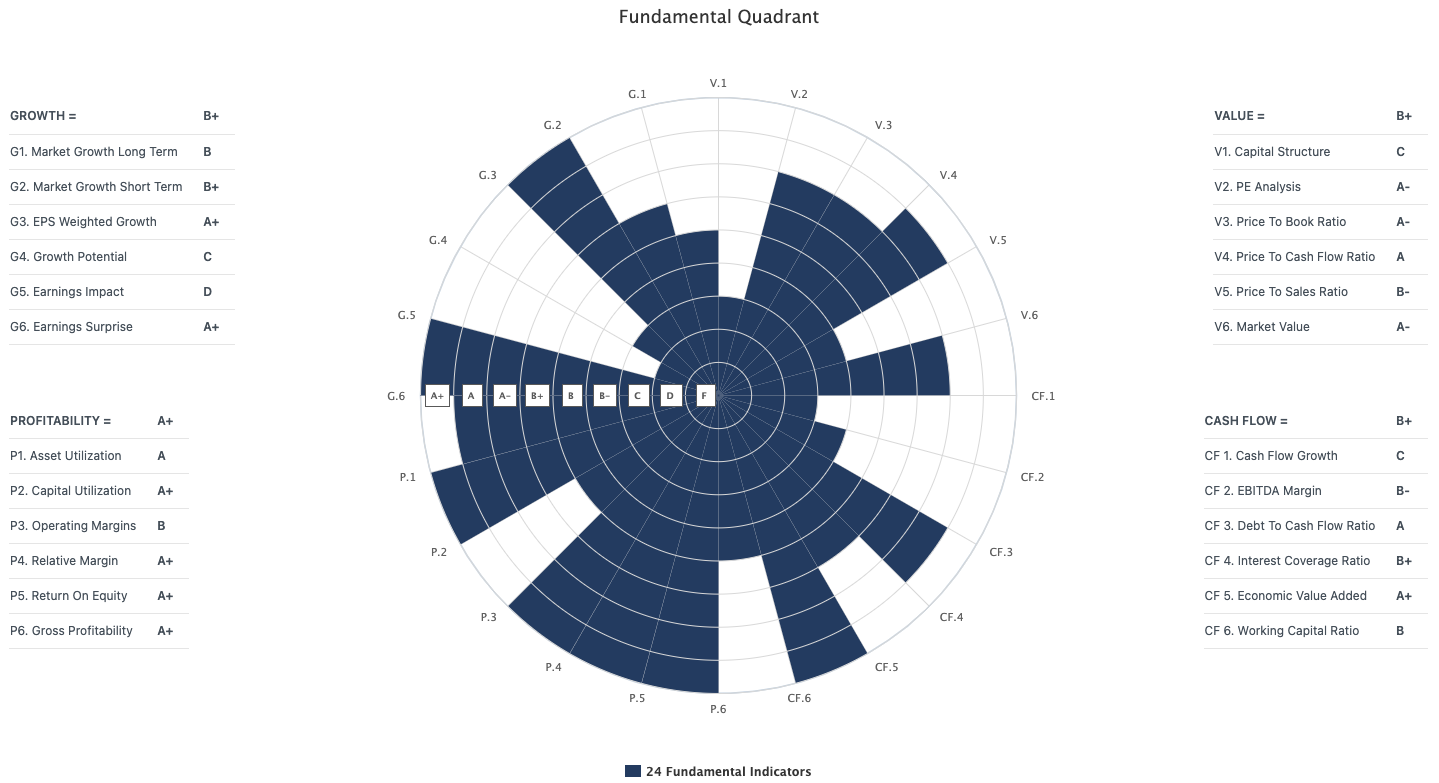
In fact, using MarketGrader’s Fundamental Quadrant, the only red flags are earnings impact and cash flow growth.
Earnings Impact shows that the stock doesn’t always react favorably to a good earnings report. That was true last week, when shares dropped over 3% following an earnings beat.
Cash flow growth indicates that the company hasn’t grown its cash flows appreciably over the last few years.
Most importantly for me, their data shows that the company’s revenues and operating margins are growing. I’ll take that combination any day.
Shares are anything but overvalued. ANF has a PE of 13, which is less than half of the S&P 500’s PE. MarketGrader has strong growth expectations for the company and I expect that multiple to improve.
As I said above, I don’t trust this market as far as I can throw it. But cyclicals seem like decent place to park money right now because of their recent outperformance, and ANF has both technicals and fundamentals that put it in a good position.
Shares are near the top of their recent range. I’d prefer to buy in the low 150s, with a stop loss about 10% lower, with a chance to make over 50%.
At the time of publication, Meshnick had no positions in any securities mentioned.
