A Rotation Into Overbought. But What's Up With the Insiders?
The hallmark of this market since August has been the constant rotation. Well, we've rotated into overbought already so let's look at where we are and answer your questions.
You've reached your free article limit
You've read 0 of 1 free Pro articles.
The Market
The hallmark of this market since August has been the constant rotation. For example, we were all set to get overbought late last week/early this week but you might have noticed that breadth was negative almost every day last week. The one day it wasn’t, it was +50.
That means the overbought condition has already taken hold on the majority of stocks but last week we got rotation into the index movers so the S&P and Nasdaq (but not the DJIA) were all higher on the week.
That sets up an interesting situation for the coming week. Do the index movers take a breather from the overbought condition and all the other stuff that has been so droopy for the last week or so find some friends and rally? That is pretty much what we’ve seen since August.
Last week we looked at the chart of XLI, which failed to make a new high, or did so just barely before heading back down. But this uptrend line has held with four touches since August. Does it hold this week?
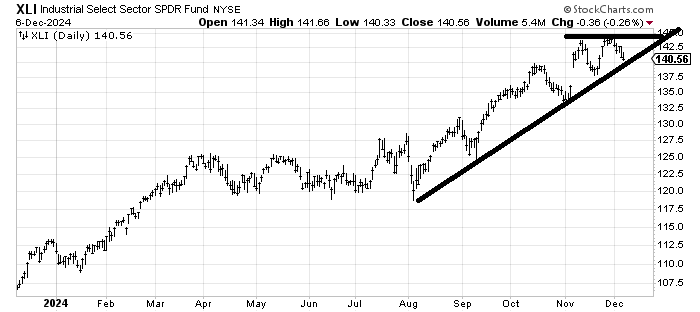
The first scenario is it holds and the rotation stays intact. The second is that it breaks but by midweek it is so oversold—let’s say it comes down to the mid November low around 137-138—and then bounces. The second scenario obviously changes the pattern and becomes more noteworthy.
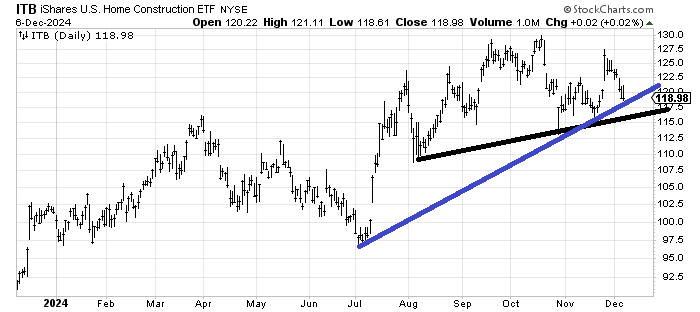
There is also ITB, an etf to be long the homebuilders. Bonds were up last week (interest rates down) but the homies came down quite a bit. The blue uptrend line is not as good as the one on the XLI (fewer touches). I prefer the black one (it’s flatter). So here the 115 area is what to watch.
But look at this chart (remembering the XLI did not make a higher high) and notice the homies are where they were in July (as are the semis).
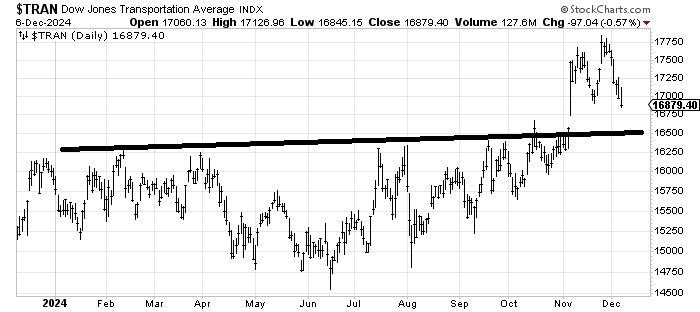
The Transports were also smacked hard last week and are now closing in on the gap up from the election, having made a marginal lower low (than mid November). I am watching all of this closely because they are all quite economically sensitive.
Finally, in terms of groups. We got the rally in bonds. TLT got right into that 94-95 area that was my initial target zone. I would take a few profits. My guess is we see a back off and another try upward though.
But Utes, REITs and staples, all groups that ought to rally with lower rates (and the Homies noted above) were down last week. All of this might be nothing more than the either/or market which means when the index movers get the love it is at the expense of everything else but I have put it on my radar.
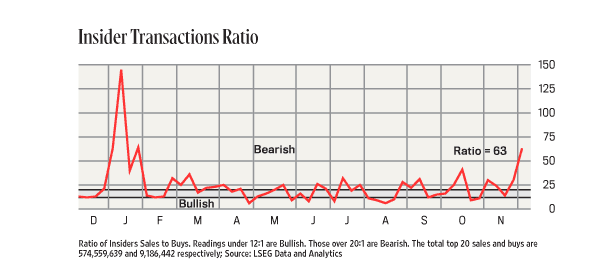
We all know about the too bullish sentiment but now we also have Insider sales picking up. The ratio is the highest since January. Keep in mind how many stocks topped out in the first quarter of this year and then did nothing (see IGV as the best example) for the next six months.
New Ideas
For the last week I’ve been covering a lot of stocks in the Q&A section as requests come in. But note many of them are down and out names where folks are looking for a year end/early January bottom fish trade. So be sure to check that section out.
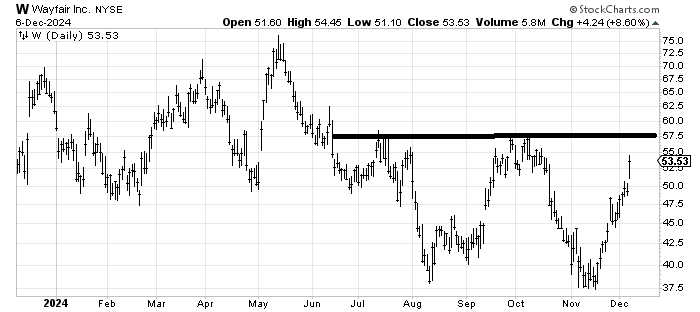
We have had a terrific ride in Wayfair W as it is up about 40% since I recommended it. I want to follow up by noting that it is coming into a resistance area. I suspect it struggles to get through on this first trip up.
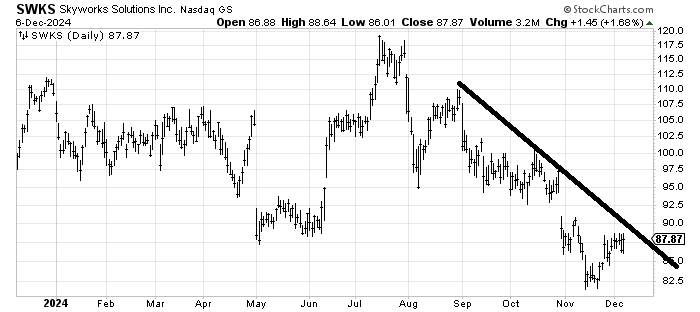
I will continue to search for bases (few and far between now) or down and out stocks (like European markets from last week). Thus my eyes fell upon Skyworks Solutions SWKS. As long as it stays over 85 I would look for it to try and fill that gap.
Today’s Indicator
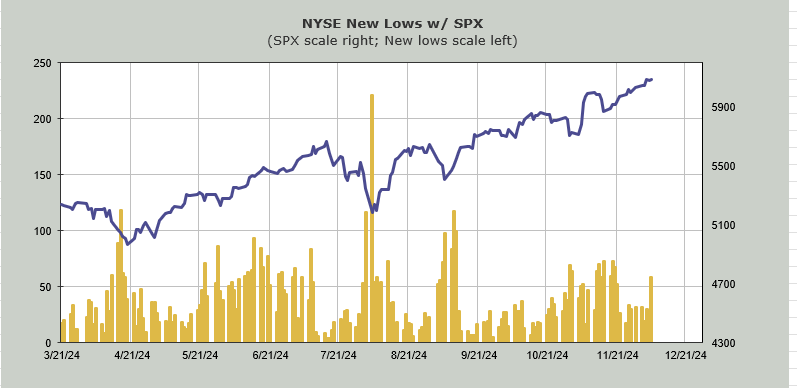
The new highs continue to lag and Friday we saw a pick up in new lows on the NYSE which we hadn’t seen all week.
Q&A/Reader’s Feedback
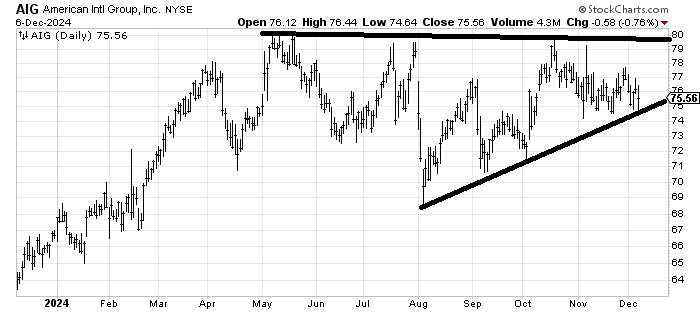
American Int’l Group AIG is an interesting chart with a decent risk/reward. I would prefer that it stay over 74 because under there it breaks the uptrend line and the recent lows. But if it can continue to round under and curl upward from here this starts to look like one of those long sideways charts (also not that here is yet another stock that peaked in the first quarter and did nothing the remainder of the year).
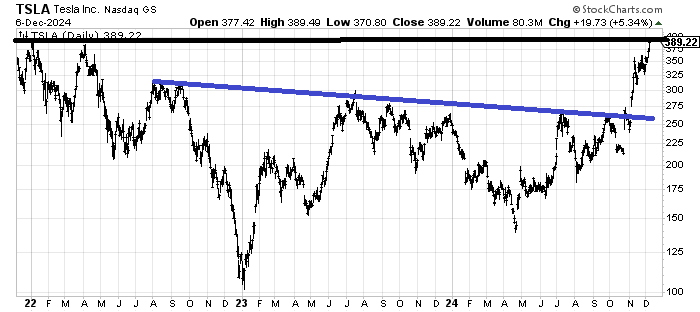
Tesla TSLA has had a terrific run—right to resistance. The base it broke out from (blue line) measures into this 380-400 area. I’d be keen on taking some profits. It hasn’t done anything wrong though. It is just over extended and at resistance and a measured target. If it can do a little sideways action or pullback to set up another pattern I might like it again.
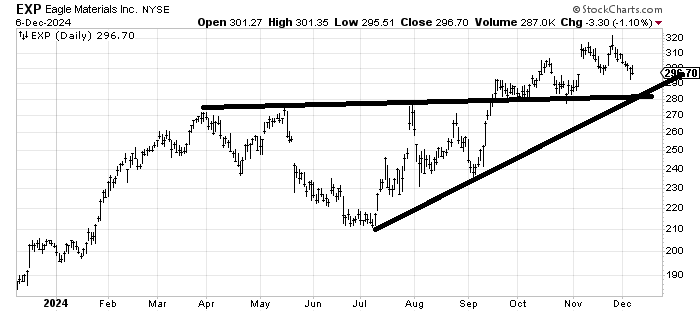
Eagle Materials EXP is somewhat similar to the XLI chart above. It has filled the gap up from the election and has decent support in the 280-290 area. (Notice here is another chart that peaked in the first quarter and did nothing for the next six months). It’s probably oversold in the short term but I just don’t find it compelling for more than a bounce. At 280 I would think it is very oversold and due for a better bounce.
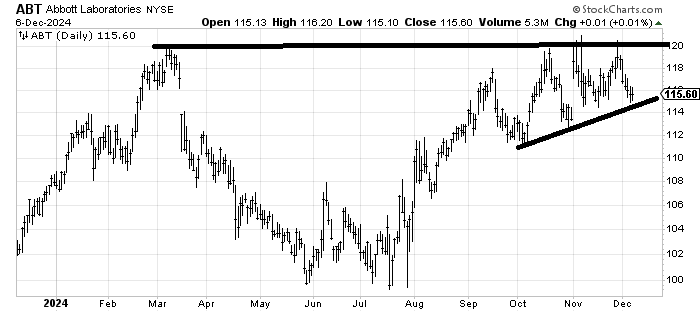
I have been waiting for Abbott Labs ABT to breakout over 120 for two months now and it refuses to do so. I do not want to see it break under 112 (also note yet another stock that peaked in the first quarter of this year).
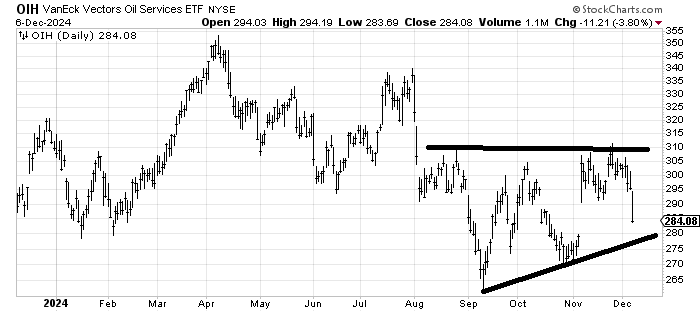
OIH an etf to be long oil service stocks has been terrible. I had thought it had a chance to cross over 310 but I was dead wrong. It fills a gap and tags an uptrend line around 280 and I would expect a bounce from there.
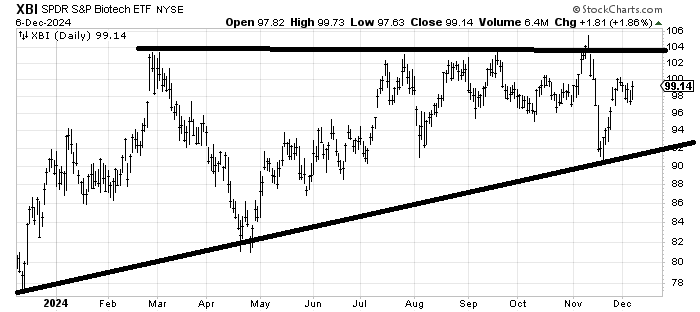
If XBI can get over 100 it should run to 104-ish. I am still hopeful this turns out to be a base. Also note this is yet another chart that peaked in the first quarter and did nothing the remainder of the year.
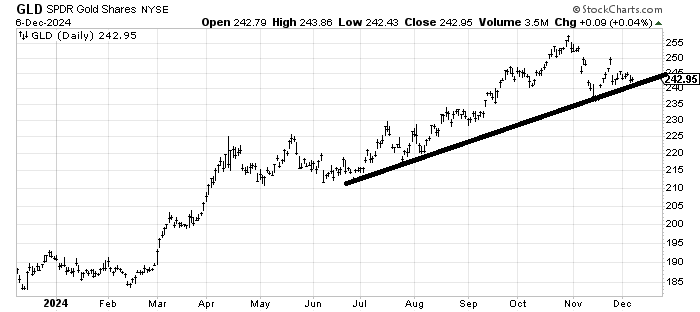
GLD is a chart I have not liked for a few months now. Will it hold 240? Hard to say. If it just languishes the way it did from April until July for the next few months I might like it again. It seems to me the GLD folks have moved over to BTC for now.