A Frustrating Earnings Season
It's hard to make money in an environment where there are a lot of gaps up and down but little trend. We'll also take a look at FCX, CRWD, NVDA, and AMD.
You've reached your free article limit
You've read 0 of 1 free Pro articles.
The Market
If you find yourself frustrated over the last few weeks in the market, there is a reason. This earnings season, like most of them, there have been a lot of gaps up and gaps down so if you are one who likes to play earnings then you are not bothered by the market’s action.
But let’s go back almost three weeks in the market to October 11th. The S&P closed at 5815. Today, it stands at 5813. The Russell closed at 2234. Today, it stands at 2233. Nasdaq has fared the best of the bunch, but the QQQs saw a close of 493 on October 11th, and today they stand at 495.
There is one group that has moved a lot, though, or relatively speaking, a lot. The SOX closed at 5335 on October 11th, and today it stands at 5153. The Bank Index is up two points in that time, or about one percent.
It’s not exactly been a barn-burner because in that time, we have seen breadth lose ground. In that time we have seen the McClellan Summation Index lose ground. In that time we have seen the number of stocks making new highs on the NYSE go from 206 to 126. Nasdaq’s new highs have gone from 293 to 158.
It’s hard to make money in that environment.
Earlier this week I said the short term was oversold (but not the intermediate term). That is still the case, but take a look at my Oscillator. You see that lower high in mid-October? Way lower. All the other overbought readings made it up to the highs, but not this one. And now it’s made a lower low. That is a big loss of momentum.
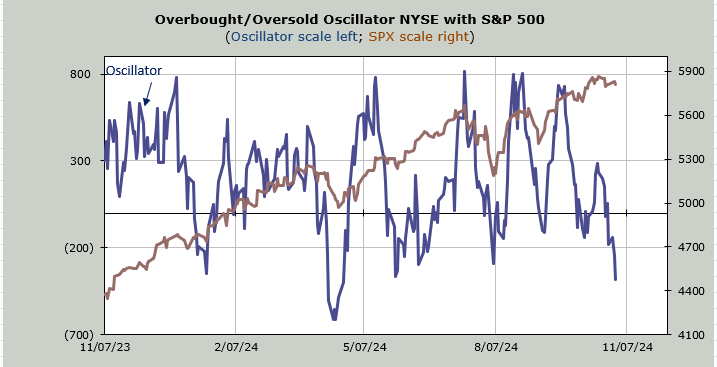
The difficult part of this is that we’ve seen this momentum indicator slide lower on very little price movement in the indexes. The best oversold conditions we’ve seen have been accompanied by a plunge in the index. Like August 5th or even early September, or the best of the bunch: April.
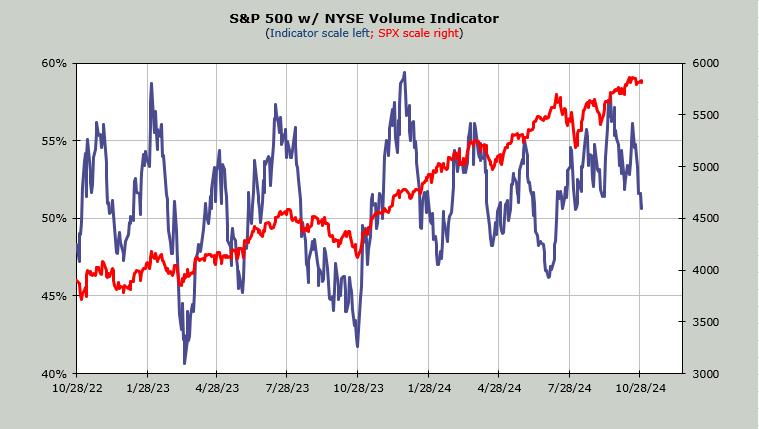
We should start seeing some of the intermediate-term indicators move to an oversold condition in the coming weeks. The Volume Indicator, shown below, is already at 51% (it needs a reading in the upper 40s to get oversold).
A move in the indexes also tends to help sentiment get bearish. Right now, it remains complacent.
New Ideas
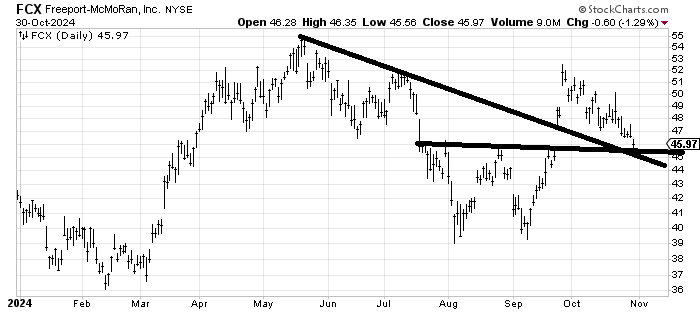
In a healthy market this move in Freeport McMoRan FCX from 52 to fill the gap at 45 ought to be a positive but it is more like a stock that has dribbled lower not one that has seen an panicky gave fill. There are simply too many charts like this.
Today’s Indicator
The Volume Indicator is at 51%. To get it to oversold, it needs a reading at least near 47%
Q&A/Reader’s Feedback
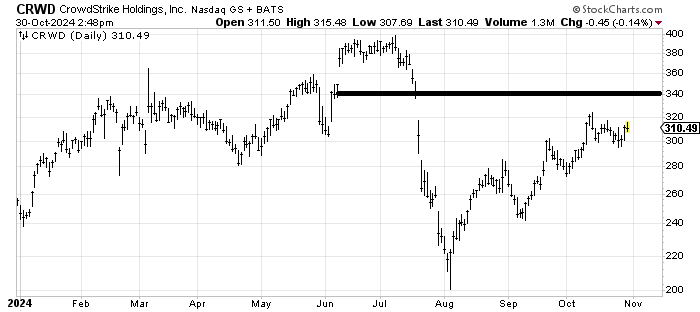
I believe CrowdStrike CRWD ought to fill that gap near 340. But I can tell you that I thought that a few weeks ago and as you can see it failed to do so. It will continue to get the benefit of the doubt but a break under last week’s low (call it 295) would have me thinking I am wrong. I will note that there is no base to speak of so it is not as if I believe this is a good chart. It would have to gap up over 340 for me to see that.
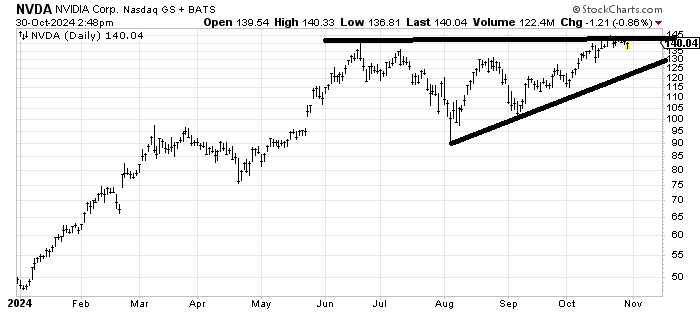
We last looked at NVIDIA NVDA when the stock was in the low 120s. At the time I said I didn’t think it was bearish but I also did not think it was terribly bullish. I thought it could rally but wasn’t going far. Well it did go to 140 so it went further than I thought. But my sentiment is the same. The chart feels vulnerable to me. Like it needs a correction. Even a trip down to that uptrend line before earnings would probably be a better setup.
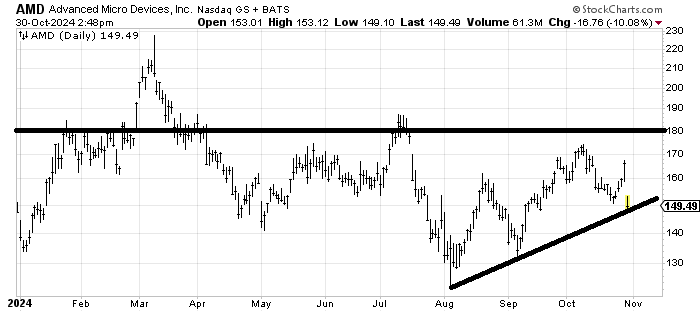
Forty years ago the market was obsessed with AMD vs INTC and now it’s AMD vs NVDA and the chart says AMD AMD isn’t winning. As a pure chart, it’s got support here, so the risk/reward isn’t terrible. It would be much better if we were intermediate-term oversold. Take a glance at the late April low: it was a gap down into a slide that had been going on for two months which is what an oversold stock looks like. This has been a chopfest almost the entire year.