A Close Look at Oracle Stock Ahead of Earnings
Here's what traders should know as the software giant gets set to report results.
You've reached your free article limit
You've read 0 of 1 free Pro articles.
Software giant Oracle ORCL is slated to report its latest quarterly results Tuesday evening.
Let's check out the charts and indicators to see how things look ahead of the print.
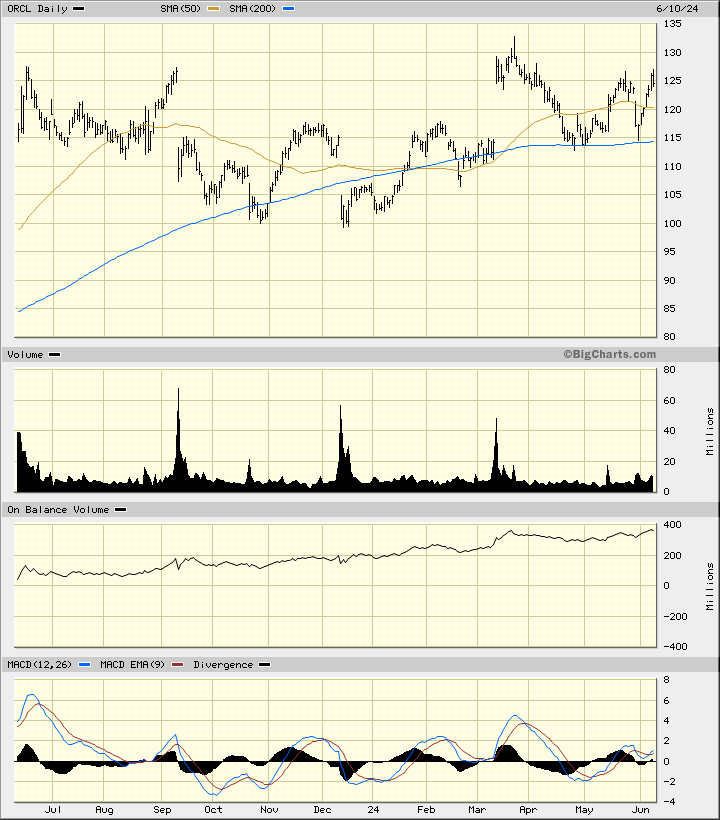
In this daily bar chart of ORCL, below, I can see that the shares have improved since December. Prices have made higher lows and now trade above the 50-day moving average line and above the 200-day moving average line. In April and May we can see ORCL bouncing off the 200-day line.
The On-Balance-Volume (OBV) line has been in a rising trend the past year. The Moving Average Convergence Divergence (MACD) oscillator is slightly above the zero line.
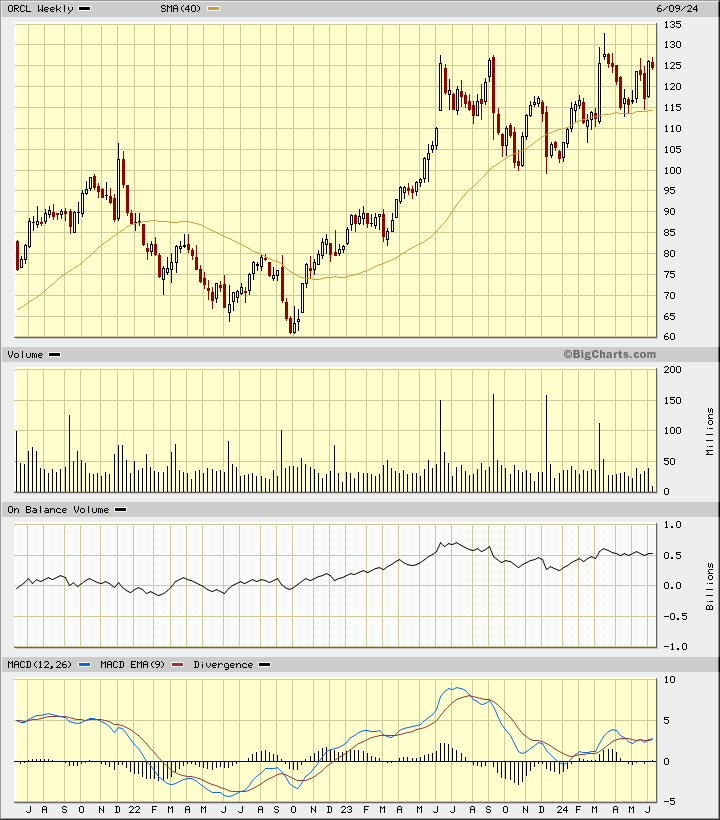
In the weekly Japanese candlestick chart of ORCL, below, I see a mixed picture. The shares are in a longer-term uptrend as ORCL trades above the rising 40-week moving average line. The OBV line has been weakening since last June. The weekly trading volume histogram shows a decline in activity the past year.
The MACD oscillator is above the zero line but made a much lower high in 2024 versus 2023. Over the past three months I can see both upper shadows and lower shadows. Should I flip a coin?
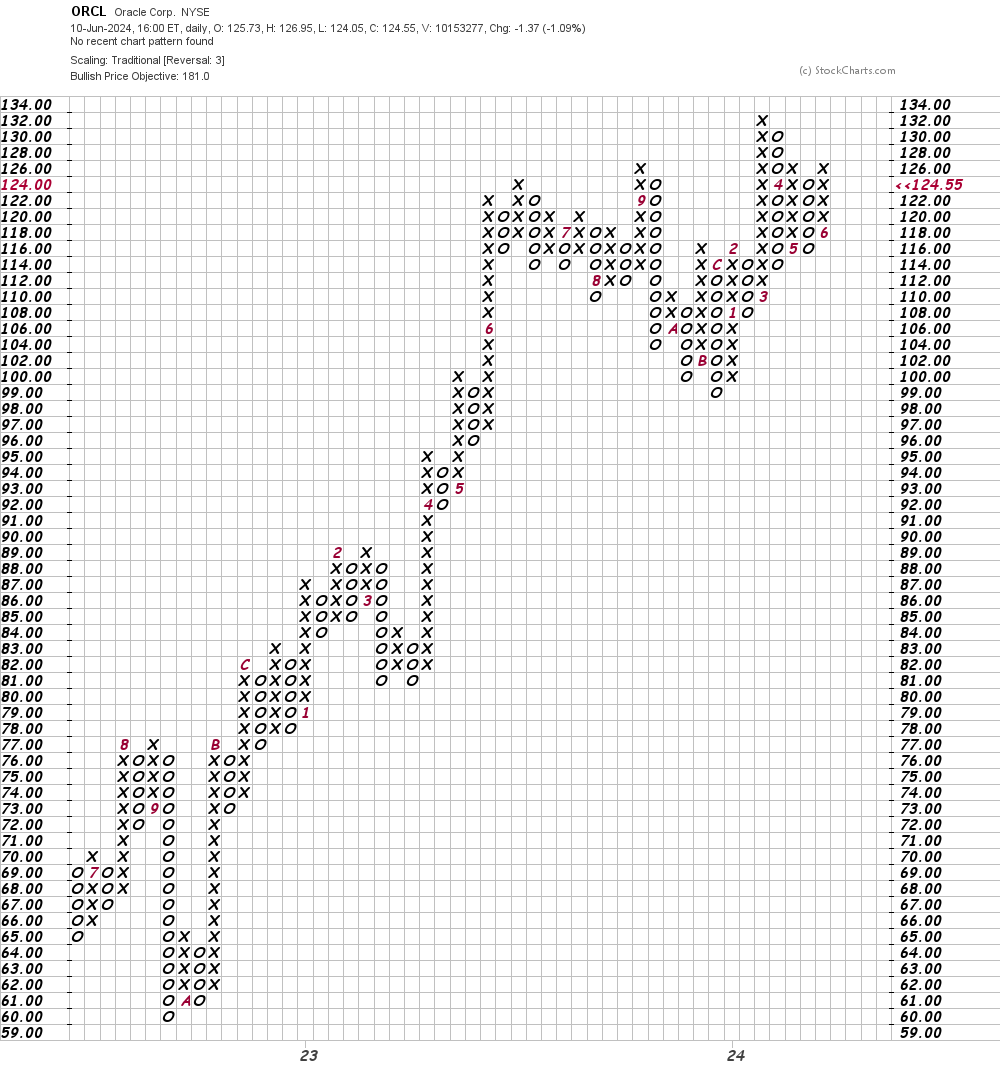
In this daily Point and Figure chart of ORCL, below, it is suggesting a potential upside price target in the $181 area.
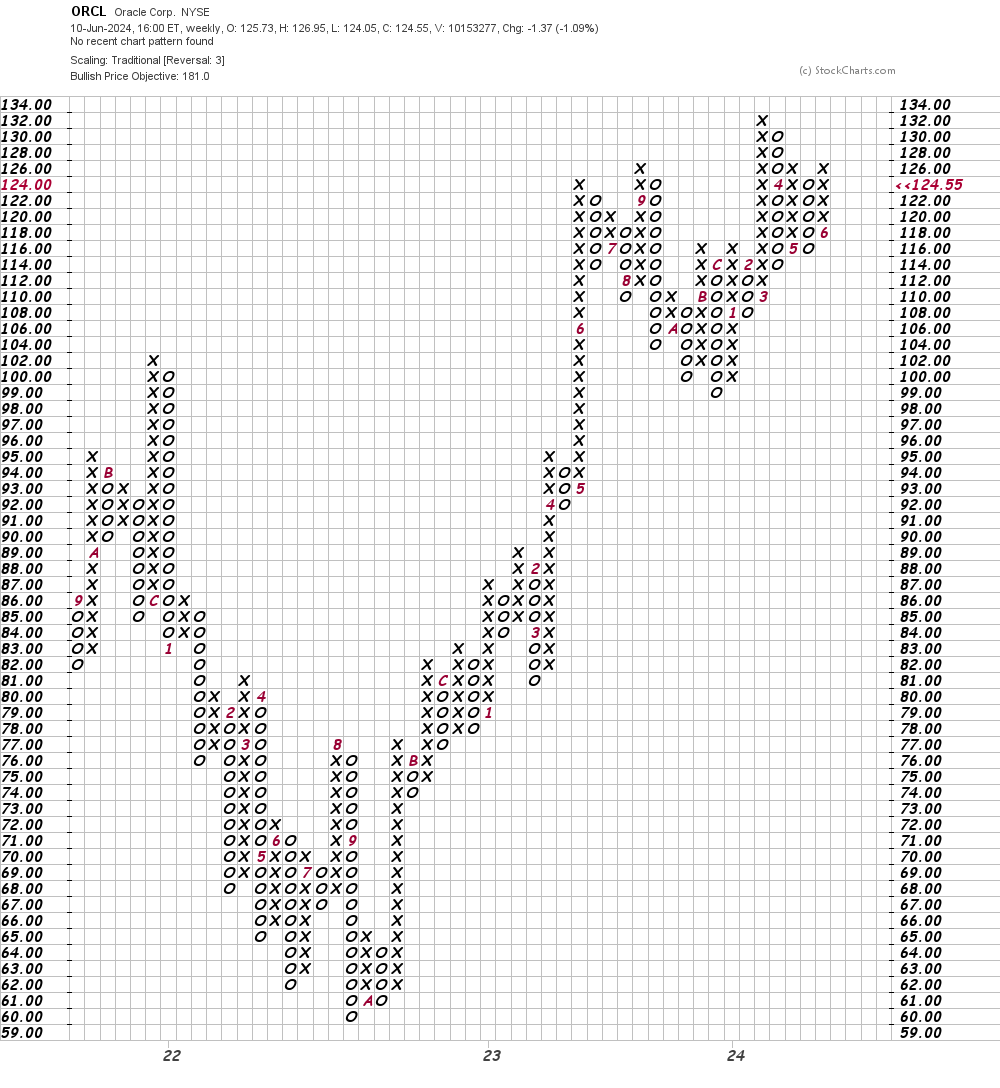
In this weekly Point and Figure chart of ORCL, below, I can see the same price target as shown on the daily chart above: $181.
Bottom-line strategy: I have no special knowledge of what ORCL will tell shareholders Tuesday evening. The charts above are mixed but with the edge going to the bulls. Weakness under $115 could turn the charts bearish.
Employees of TheStreet are prohibited from trading individual securities.