3M's Weakness Does Not Look Like a 'One and Done' Move
The company gave investors disappointing guidance on Tuesday.
You've reached your free article limit
You've read 0 of 1 free Pro articles.
3M Co. MMM reported its latest quarterly numbers Tuesday morning before the opening of trading. Results for the fourth quarter beat Wall Street expectations but the company gave a 2024 profit outlook that was well below forecasts and its share price gapped lower on the opening and has been in the red all day.
Let's check out the charts and indicators and see what's next for the stock.
In the daily bar chart of MMM, below, I can see that the shares gapped sharply lower Tuesday. Prices gapped below both the 50-day moving average line and the 200-day moving average line. Frankly, you don't see that happen all that often. The shares have continued to weaken further since the open.
The daily On-Balance-Volume (OBV) line is likely to turn lower Tuesday after a modest two-month rise. The Moving Average Convergence Divergence (MACD) oscillator crossed to the downside in early December but for now it is still above the zero line.
In the weekly Japanese candlestick chart of MMM, below, we can see the past three years of price activity but Tuesday's action is not plotted. The shares are back below the 40-week moving average line.
The weekly OBV line has been pointed lower since early December. The MACD oscillator moved above the zero line but it is narrowing and likely to cross to the downside.
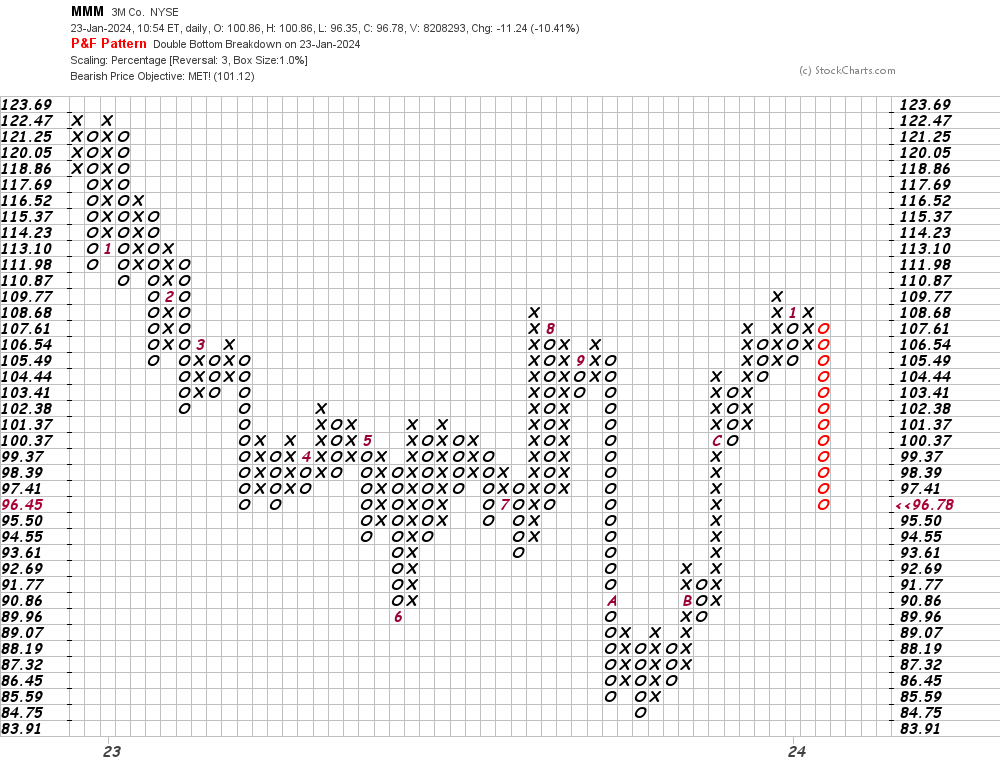
In this daily Point and Figure chart of MMM, below, I can see Tuesday's price movement with the price gap filled in. Prices have reached and exceeded a target in the $101 area.
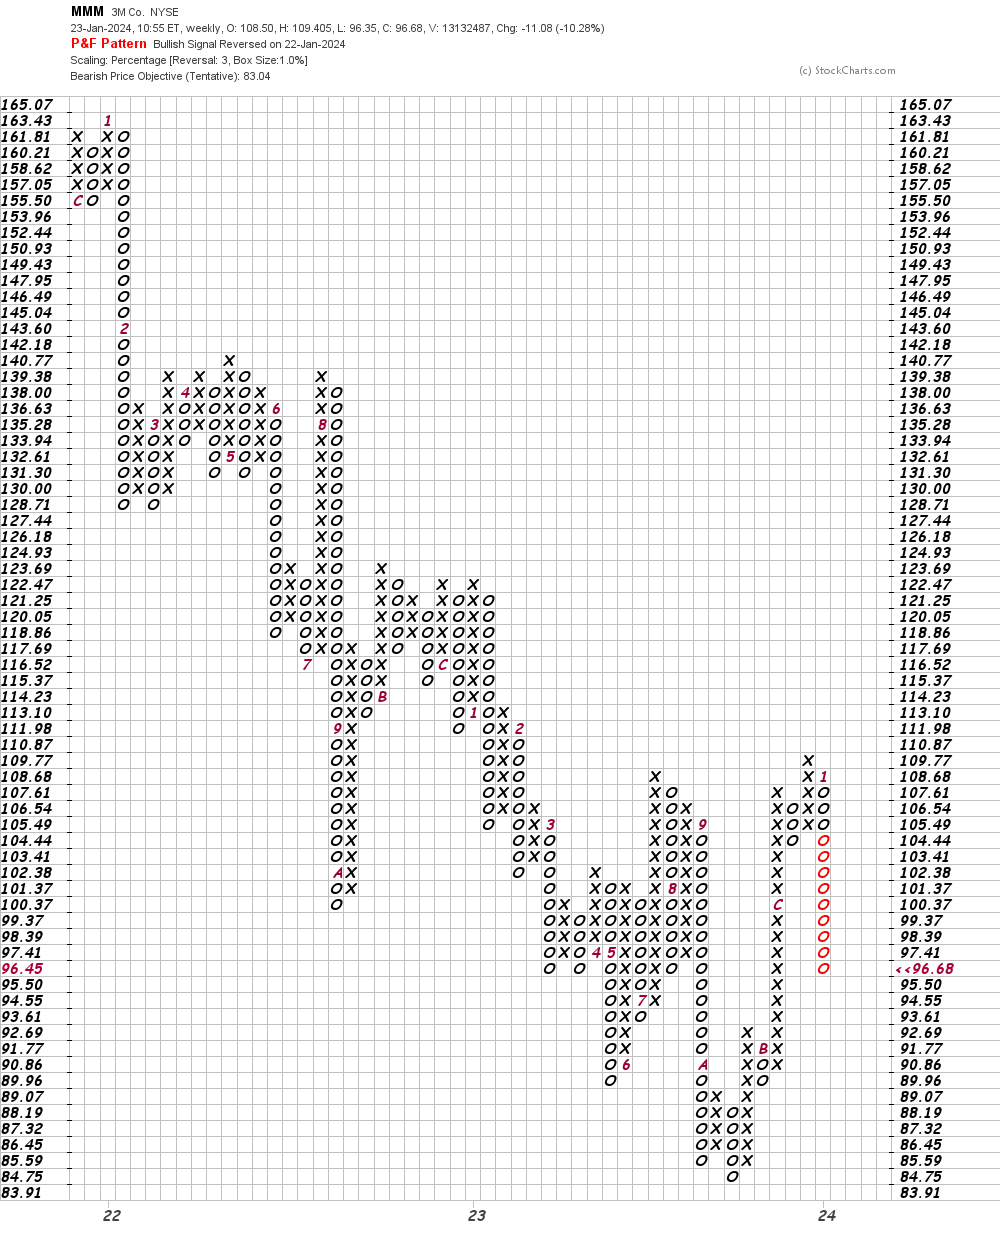
In this weekly Point and Figure chart of MMM, below, I can see a price target in the $83 area.
Bottom-line strategy: Tuesday's weakness does not look like a one and done move. Further declines look likely in the days and weeks ahead.
Employees of TheStreet are prohibited from trading individual securities.