Traders Aren’t Giddy… Yet
The DSI and options trading activity suggest the possibility of volatility on the horizon.
You've reached your free article limit
You've read 0 of 1 free Pro articles.

I do not think folks headed right back to giddy late last week. Do I think they could get there? Definitely.
You see, the DSI for the VIX has fallen back to 16, while the DSI for the Nasdaq and the S&P have pushed back up to 71 and 72, respectively. So, there is a chance—just a chance—that if we do get the oversold rally I anticipated this week, we could see the two index DSI’s well over 80 at the same time the VIX DSI gets back to being a tween.
Just a reminder on the DSI, it is based on a scale of zero to one hundred. When we get single digits, we are buyers, and when we get over 90, we are sellers. If we get the VIX DSI at 10 or below at the same time we get the indexes at 90 or above, then we are looking at more than just a bout of volatility. The corrections off of those sorts of readings tend to be much more serious. For now, that is a long way off.
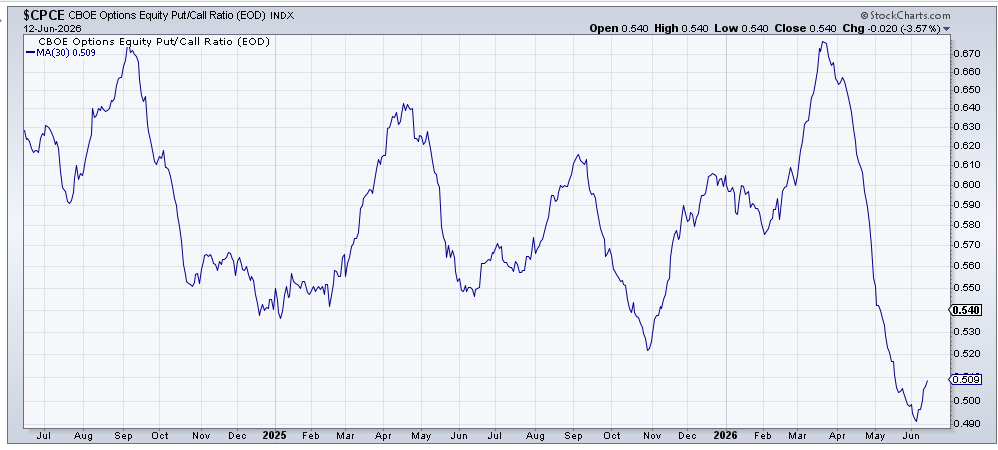
On the options ratio front, we did see a serious switch on Friday. After loading up on puts all week, the call buyers were back in action with the total put/call ratio at .76, which is the lowest reading since June 2nd. However, the equity call buyers were not as aggressive as the equity put/call ratio was a more neutral .54.
As a reminder, the 30-day moving average of the equity put/call ratio is at the very low end of the range, so it remains in ‘giddy’ territory.
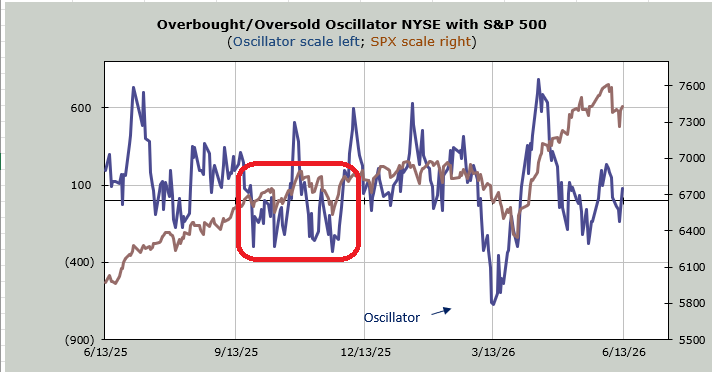
As for the oversold condition, we did jump the gun by a day or so, but it’s not as if the Overbought/Oversold Oscillator is back at the top of the page (overbought). Rather, it remains oscillating near the zero line. Once again, I expect the Oscillator pattern will play out somewhat similar to the way it did last fall. So, I do not have a date or time frame yet for getting back to an overbought condition. For now, I have penciled in late next week, but that’s a long way off for this indicator.
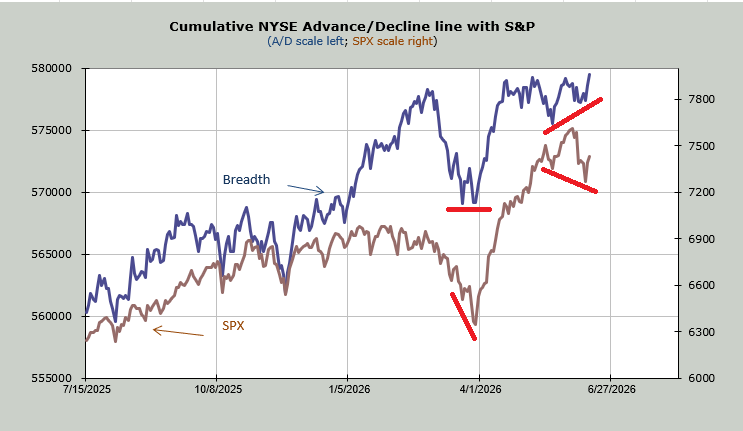
As the indexes came down last week, the number of stocks making new lows contracted. Breadth, too, did not make a new low, and on Friday it made a higher high. On the chart below, you can see the lower lows in the S&P (brown) and the higher lows in breadth (blue). So for the first time since the rally began in late March, breadth led last week, not the Terrific Ten.
I do not think whatever rally we get will have the oomph that the March low had because the indicators are in much different places. Just look at the 30-day moving average of the equity put/call ratio above. It was at the top of the page in late March, and it is at the bottom of the page now. If we get some follow-through on the oversold rally, I expect sentiment to flip to bullish much quicker than it did in April.
