Chart of the Day: Axon's a Safe Bet
Let's look at the chart of the AAP holding Axon.
You've reached your free article limit
You've read 0 of 1 free Pro articles.

The chart of Axon Enterprises AXON is looking very strong and bullish -- and that's just before earnings are to be released. Sounds good so far, but let's check the chart.
After putting in a nice floor near the $180 level, the stock took a step up and put in another floor.
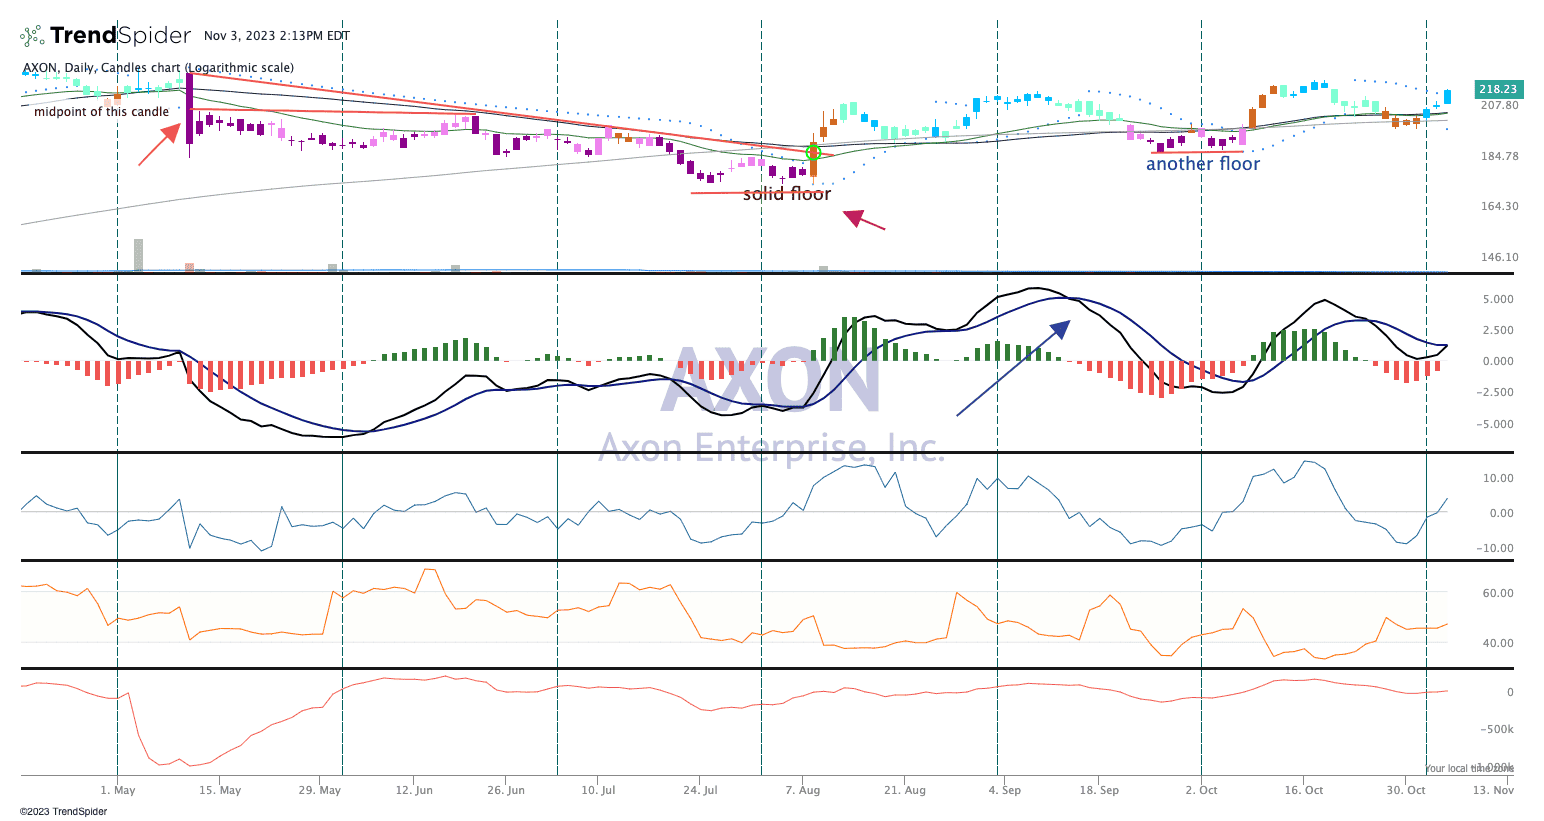
It's great to have these levels of support so clearly shown on the chart. A higher-low is in place and today's breakout on strong turnover means good things for Axon.
The big bar to the left, when the stock was hammered following the May earnings report, is now being hunted down as a target. That high level is $227; Axon is 4% below that price, and if that gets hit, we have plenty of room to the upside, at least $250.
The Price Rate Of Change indicator, or ROC indicator, in pane 3, shows us the rate of change. It tells us how the change in price today compares with some days ago, in this case nine days ago. The ROC is moving up nicely.
The Moving Average Convergence Divergence (MACD) oscillator is also on a buy signal; the crossover move here above zero is important to establish where the trend is starting. MACD tells us the change in trajectory before it actually happens. The blue candles in the top pane (GoNoGo) are flashing "strong bullish," while the parabolic SAR (stop and reverse) just turned bullish, as well. All looks good with this chart and the prospects for higher prices. We rate AXON a "One" in the Action Alerts PLUS portfolio, which means buy at anytime.
For a more detailed look at the chart, click here.
AAP is long AXON.