Bitcoin and Ethereum Are Starting to Earn Back My Trust
Persistent buying under Bitcoin’s key support level and improving momentum in Ethereum are shifting my trading bias back to the long side.
You've reached your free article limit
You've read 0 of 1 free Pro articles.

Three weeks ago, I wrote that I had no interest in trading Bitcoin until my usual setup returned. I wanted price above the 8-day and 21-day exponential moving averages. I wanted momentum to improve. And I wanted buyers to start initiating at higher prices instead of merely responding whenever Bitcoin fell.
That setup is beginning to return.
Ethereum has the cleaner chart. Price has moved above the 8-day and 21-day EMAs, and the 8-day EMA has remained above the 21-day since early July. It’s not something we need to bang the desk over, but I see it as short-term bullish.
More importantly, price and both exponential moving averages are above the still-declining 50-day simple moving average. Price has also reclaimed $1,815, the area where selling was cut off in early and late February 2026.
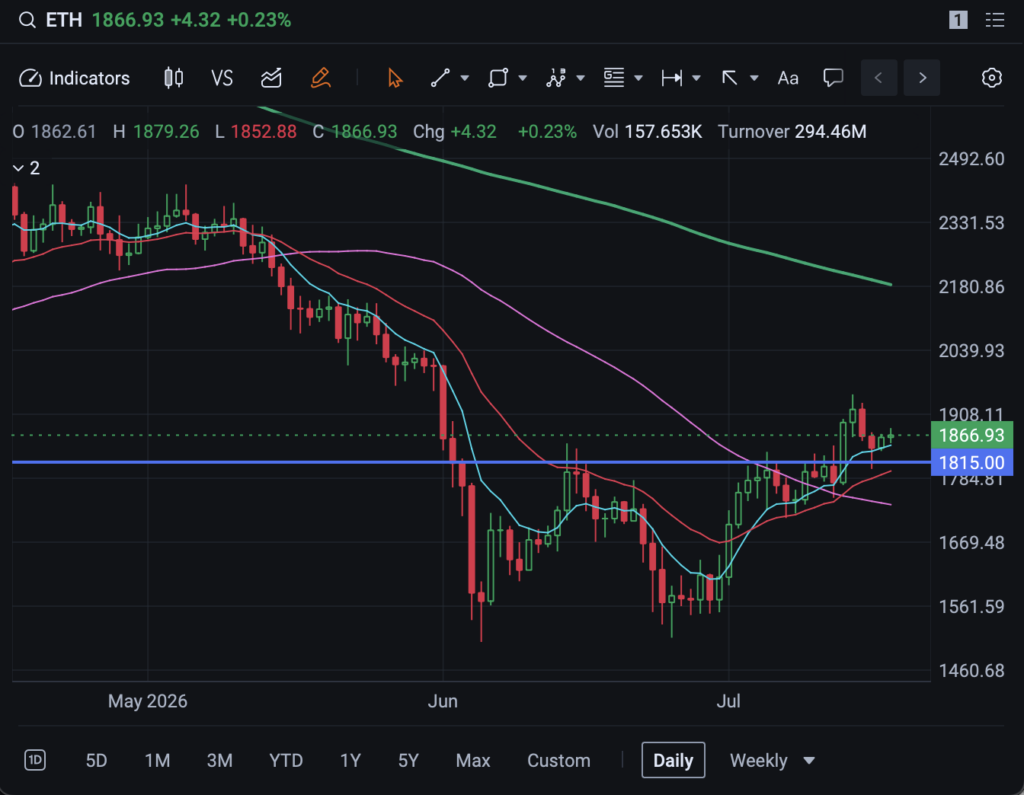
As long as Ethereum remains above its short-term moving averages and the 50-day SMA, my trading bias is bullish. Continued rotation around $1,815 is probably the most likely near-term outcome, but I think price is headed toward the declining 200-day SMA near $2,180 over the next month or so.
I don’t expect Ethereum to trade up to the 200-day SMA and simply blow through it. That’d be too easy. While I am becoming a bit more bullish on crypto in general, I suspect it will take some work for price to break above that level and sustain the move. Longer-term investors are probably better off waiting for Ethereum to hold above the 200-day SMA and begin moving higher before getting too aggressive.
Bitcoin’s chart is similar, though not quite as clean.
Price is back above the 8-day and 21-day EMAs, along with the declining 50-day SMA. But recapturing those moving averages isn’t what should concern the bears. It’s the persistent responsive buying under $60,000 that should have sellers scrambling.
You see, when Bitcoin broke through its February lows in early June, the bears had a clear shot at driving it well below $60,000. They tried repeatedly and failed. Selling continues to get cut off whenever Bitcoin trades under that level.
The monthly chart explains why. The area around $60,000 marked major tops in 2021 and sat near the center of Bitcoin’s lengthy 2024 consolidation. For one reason or another, supply is being absorbed around that level.
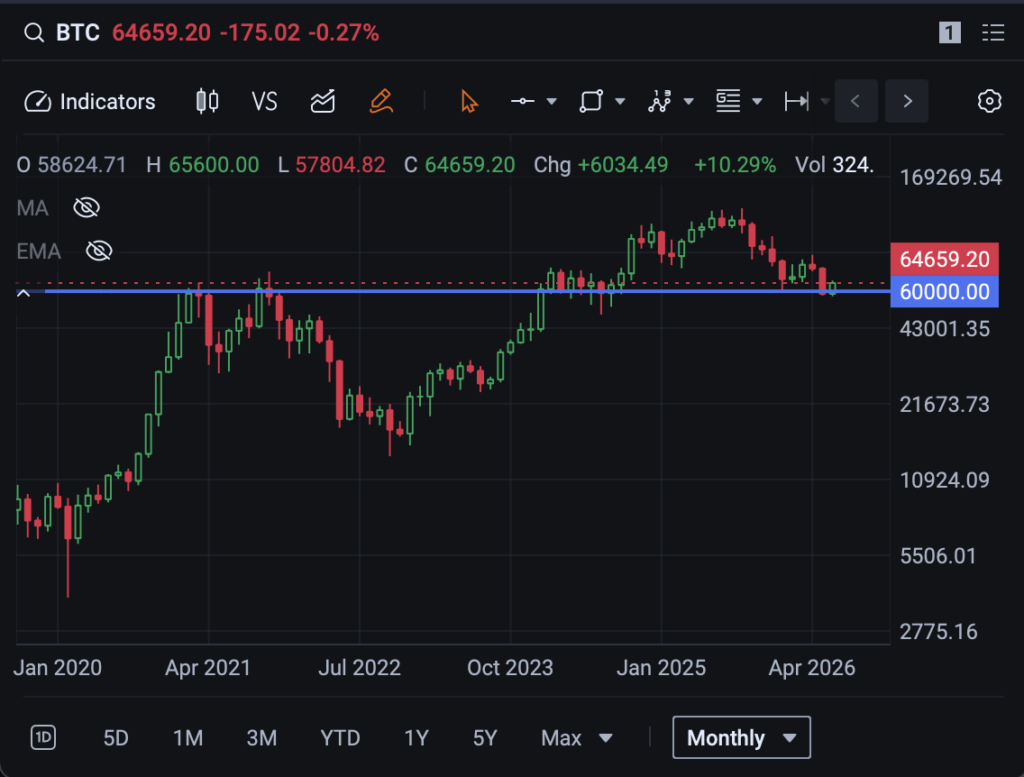
The near-term line in the sand is $65,000. A sustained move above it should bring the declining 200-day SMA near $73,000 into play. We tested that moving average in May, and I suspect Bitcoin will test it again over the next month.
This is not a new bull-market declaration. But for trading purposes, I am leaning long while Bitcoin and Ethereum remain above their 8-day and 21-day EMAs and responsive buying continues to overwhelm initiative selling. The buyers are finally giving us something to work with.
At the time of publication, Byrne was long IBIT, ETHA, and BTC.