Weekly Roundup: Trump’s Friday Threat Sours Market, But Portfolio Continues to Perform
We started a new position, added to two existing ones, and named a new Bullpen contender this week.
You've reached your free article limit
You've read 0 of 1 free Pro articles.
The stock market and TheStreet Pro Portfolio were advancing nicely throughout the week until Friday, when President Trump threatened a “massive increase” of tariffs on goods from China, citing recent “hostile” export controls on rare-earth minerals. That led the market and the Portfolio to give back some of their recent gains, as did the White House’s comment on Friday that it is making good on threats to fire thousands of federal workers amid the government shutdown. Per reports, “thousands of people will be laid off as a result of the shutdown,” but the scope of the cuts is not clear.
That combination of developments introduced the latest wave of uncertainty into the market, and it pushed the Volatility Index to touch its highest reading since mid-June. In the coming days, it should become much clearer how much of President Trump’s renewed tariff threat on China is bluster, and how large federal layoffs will be.
We’ve talked a lot about how the market multiple has become increasingly stretched. The S&P 500 has notched new high after new high, while the market has been relatively complacent. When the market is in that condition, it doesn’t take much to knock it off its perch, leading short-term traders to take profits and exaggerate downside moves in the process. Friday’s back-to-back developments plunged the Fear & Greed Index deep into “Fear,” which suggests the degree of selling that weighed on the market was more of a knee-jerk reaction to the day’s headlines.
Not that we are casually dismissing them, but we’ve seen this game of Trump tariffs and federal layoffs enough before to recognize there tends to be more bark than bite. Which is why we’re holding steady until we have a more definitive take on this potential “massive increase” of tariffs and a quantifiable one on federal layoffs. Our goal is to remain rational investors, not ones that overreact emotionally.
As we digest developments in Washington over the weekend and into next week, we’ll watch how the S&P 500 and Nasdaq Composite stack up against their next layers of support and drink in learnings as September-quarter earnings season kicks into gear. We will also revisit recent data relative to the thesis behind the Portfolio’s holdings and do so again based on what we learn next week and the ensuing weeks.
If the landscape changes, we will do what we need to do to preserve the Portfolio’s gains and underlying capital. But let’s remember, Trump and the administration’s initial bark is far louder than its bite.
On a more positive note, in the face of the market’s decline this week, we can share that the Portfolio continued to close the year-to-date performance gap vs. the S&P 500. This speaks to our continuing to follow the data, connect the dots, and the moves we’ve made over the last several weeks. We will continue to operate in that manner, keeping our Portfolio discipline about us.
We have our shopping list, and given Friday’s market developments, we’ll start next week off with an updated table of pick-up and panic points for the Portfolio’s holdings.
Enjoy your weekend, Saturday’s Signals alert, and Sunday’s bowl of more light-hearted fare. See you back here, bright and early on Monday.
Catching Up on the Portfolio This Week
During the week, we initiated a new position in Arista Networks (ANET) with an initial target of $180. We also picked up additional shares of Costco (COST) on Thursday following its robust September comp sales report. After trimming back the Portfolio’s exposure at $71.25 on May 20, on Friday, we bought back some shares of Dutch Bros (BROS) at $50.08.
Meanwhile, the combination of falling cocoa and sugar prices led us to bring Hershey (HSY) into the Bullpen while we do more work on the name.
Following SuRo Capital (SSSS) sharing a preliminary look at its investment portfolio exiting the September quarter, we increased our price target on the shares to $12 from $10.
Exiting the week, the Portfolio’s combined moves left its cash position near 7.6%. That leaves room to make a few more strategic decisions, but past a certain point, we may need to harvest some gains to fund potential additional moves as we strive to position the Pro Portfolio for the coming quarters.
Now let’s see what others on Wall Street had to say about the Portfolio’s holdings during the week:
Monday – Raymond James raised its Waste Management (WM) price target to $256 from $250, JPMorgan inched its TJX Companies (TJX) target to $149, and Wells Fargo lifted its Microsoft (MSFT) target to $675 from $650.
Tuesday – Wells Fargo initiated coverage of Vulcan Materials (VMC) shares with a $311 target, $1 ahead of our own. The firm also increased its Meta (META) and Alphabet (GOOGL) targets to $837 from $811, and $235 from $187, respectively.
UBS increased its price targets for American Express (AXP) , Bank of America (BAC) , and Morgan Stanley (MS) shares to $340, $57, and $165, respectively. JP Morgan also boosted its AXP target to $355 from $343.
HSBC started coverage of GOOGL shares with a Buy rating and $285 target.
Wednesday - RBC names BROS shares to its top pick list, Scotiabank nudged its Welltower (WELL) target to $182, and Truist raised its United Rentals (URI) target to $1,194 from $952.
Thursday - UBS lifted its price targets for GOOGL and META shares to $255 and $900, respectively, citing an improving outlook for ad revenue. BMO Capital also upped its GOOGL price target to $294 from $225.
Cantor Fitzgerald made a big move with its Nvidia (NVDA) target, taking it to $300 from $240 as it sees the multi-trillion artificial intelligence infrastructure buildout still in the early innings with just the hyperscalers "providing significant line-of-sight into hundreds of billions of demand for the next handful of years…"
The same day, Citi raised its price target on Eaton (ETN) to $442 from $438 and opened an "upside 90-day positive catalyst watch" on the shares. Like us, Citi believes Eaton is well-positioned to benefit from "robust" data center infrastructure demand.
Friday - Barrington Research upped its SSSS price target to $11 from $10, Oppenheimer raised its Marvell (MRVL) price target to $115 from $95, and Morgan Stanley boosted its (ANET) target to $171 from $145. BMO Capital initiated coverage on Morgan Stanley shares with an Outperform rating and price target of $180.
This Week's Portfolio Videos
We cover a lot of ground during the week in our Daily Rundowns. If you happened to miss one or more of them, here are some helpful links:
Monday, October 6: One Aspect of the Government Shutdown You May Not Be Thinking About
Tuesday, October 7: Dell Upsize Is Bullish for These Holdings
Wednesday, October 8: It's 'Foolish' to Rely on Any One Data Point
Wednesday, October 8: Stocks & Markets Podcast - Our Best Picks for the Rest of 2025
Key Global Economic Readings
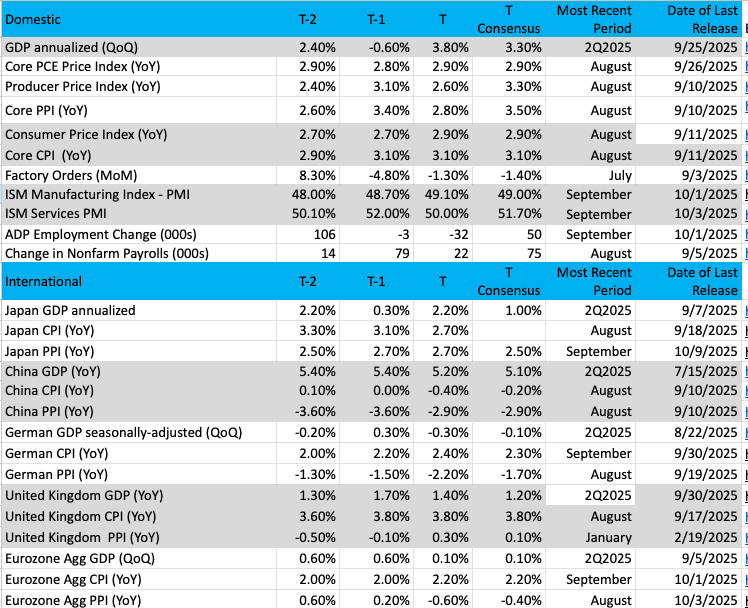
(Note: T is the most recent period, T-1 is the prior period's reading, and T-2 is two periods back, the intent being to illustrate any trends.)
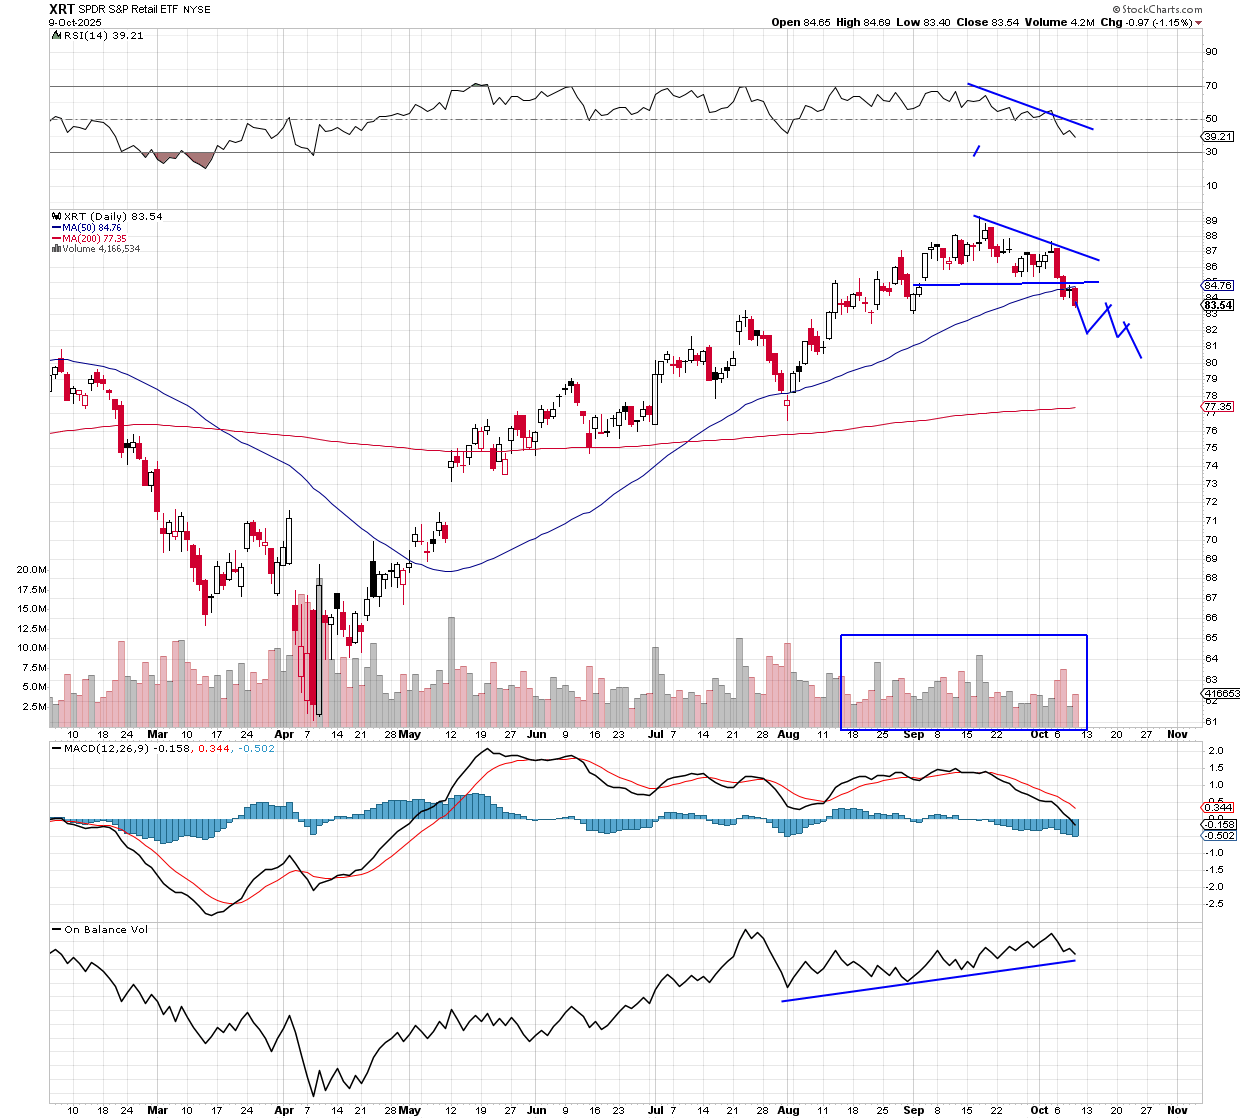
Chart of the Week: SPDR S&P Retail ETF
Don’t look now, but earnings season is just around the corner. As you already may have read, stock indexes are at/near all-time highs, but there are some groups that have been struggling. Take the retail sector, which had a strong August performance but has been poor since peaking in mid-September. If the rest of the market is exceeding expectations, we like to see the high-profile groups like retail also reaching higher.
The retail segment includes the biggest and best of the names, like Amazon (AMZN) , Walmart (WMT) , Costco (COST) , and a host of others. We can point to various causes as to why the retail group is underperforming, but a direct reason might be a slowing economy. No question the last quarter was strong, probably printing 3% growth in a couple of weeks (GDP first look), but the labor market has become a bit wobbly. If workers are losing their jobs or worse, MIGHT lose their jobs, then we could understand the hesitancy to make purchases.
On the other hand, we have seen strong retail sales figures, especially from August, during a time when kids are getting ready to return to school. Walmart and Costco saw big numbers during the summer and have not seen much backlash in pricing due to tariffs. Further, the consumer may be "saving up" to do some heavy holiday shopping when the sales come after Thanksgiving. We heard from Amazon in July about strong Prime Day sales, yet this past week, their event (Oct 7-8) was underwhelming.
Whatever the case, retail is an important element to a strong U.S. economy, as the spending consumer represents 70% of GDP in the country.
The chart of the SPDR S&P Retail ETF (XRT) has turned bearish. A fall through the key 50-day moving average this week, with confirmation to the downside, locks in this trend change. MACD has rolled over, and the on-balance volume at the bottom has done the same.
RSI is on its way down to an oversold reading. The 200-day moving average is quite a distance from current levels, but it is not out of the question. There's more support on the XRT at $81. Volume trends have been bearish.
If the XRT can recover with some positive economic news, then we could see a move back to those old highs at $89+.
Other charts we shared with you this week were:
Monday, October 6: S&P 500 - The Train Keeps Rolling, But Some Warning Signs Appear
Monday, October 6: S&P 500 Palantir (PLTR) - Is Now the Time to Add More Palantir?
Tuesday, October 7: Axon Enterprise (AXON) - Axon Took a Hit. Now What?
Wednesday, October 8: Hershy (HSY) - Hershey Has a Sweet-Looking Chart
Thursday, October 9: Amazon (AMZN) – Amazon Is Ready to Make a Move
The Week Ahead
Friday marked the tenth day of the federal government shutdown, and with indications that Congress remains deadlocked, it looks to continue. Per Polymarket, there is a 95% probability that the shutdown will end sometime after October 15. Kalshi, the other prediction market, sees a more than 60% chance that the shutdown spans more than 25 days, with a growing potential for it to be shut for ~30 days. That implies a resolution by October 31, which just happens to be after the Fed’s next policy meeting.
When the shutdown is over, we will have a lot of catch-up data to review, but until then, it means much of the data we and others utilize will go unpublished. It also means many of the rolling GDP forecasts, like the Atlanta Fed’s GDPNow model, will not be updated until new monthly data is available.
Shifting to next week, remember, even though the bond market is closed on Monday for the Columbus Day holiday, the stock market will be open. Still, we would not be surprised to see somewhat lighter than usual trading volumes on Monday.
Looking at the calendar for next week, September reports for CPI, PPI, Retail Sales, and Housing Starts were originally scheduled. TBD if we get them or not, so we’ll be following any weekend shutdown developments in Washington. We should, however, get a few regional Fed indices as well as the latest installment of the Fed Beige Book, which will be required reading for us.
During the week, we discussed the weak September jobs data shared by the Carlyle Group and Visa’s September Spending Momentum Index. Until we have all that catch-up data to sift through, we will continue to examine and assess other data sets for what they say about the economy and our holdings.
Next week brings another rash of Fed speakers, with more than half a dozen on deck as we close out the trading week. Because the Fed will enter its blackout period ahead of its upcoming policy meeting on October 28-29, those will be the last set of Fed heads making the rounds. We’ll be seeing what their take is, but odds are their post-Beige Book comments will carry more weight with us and the investment community.
Here's a closer look at the economic data coming at us next week:
U.S.
Monday, October 13
· Bond market closed, stock market open
Tuesday, October 14
· NFIB Business Optimism Index – September (6:00 AM ET)
· Redbook Index – Weekly (8:55 AM ET)
Wednesday, October 15
· MBA Mortgage Applications Index – Weekly (7:00 AM ET)
· Consumer Price Index – September (8:30 AM ET)
· Empire Manufacturing Index – October (8:30 AM ET)
· EIA Crude Oil Inventories – Weekly (10:30 AM ET)
· Fed Beige Book (2 PM ET)
Thursday, October 16
· Initial & Continuing Jobless Claims – Weekly (8:30 AM ET)
· Producer Price Index – September (8:30 AM ET)
· Retail Sales – September (8:30 AM ET)
· Philly Fed Index – October (8:30 AM ET)
· NAHB Housing Market Index – October (10:00 AM ET)
· Business Inventories – August (10:00 AM ET)
· EIA Natural Gas Inventories – Weekly (10:30 AM ET)
Friday, October 17
· Housing Starts & Building Permits – September (8:30 AM ET)
· Import/Export Prices – September (8:30 AM ET)
· Industrial Production & Capacity Utilization – September (9:15 AM ET)
International
Monday, October 13
· China: Imports/Exports - September
Tuesday, October 14
· UK: Unemployment Rate – August
· Eurozone: ZEW Economic Sentiment Index - October
Wednesday, October 15
· China: Inflation Rate, Producer Price Index – September
· Japan: Industrial Production & Capacity Utilization – August
· Germany: Wholesale Prices – September·
Eurozone: Industrial Production - August
Thursday, October 16
· UK: GDP, Industrial Production - August
Friday, October 17
· Eurozone: Inflation Rate - September
Despite a slow start to next week, things on the earnings front will start to heat up. Once again, the Financials will take the lead, and that means we will be putting the latest quarterly results from Bank of America (BAC) , Morgan Stanley (MS) , and American Express (AXP) through the wringer. We’ll be sizing up their performance and guidance against the likes of JPMorgan Chase (JPM) , Goldman Sachs (GS) , Wells Fargo (WFC) , and others.
We will also review comments about consumer spending and end-market demand as we parse through comments from Albertsons (ACI) , Domino’s (DPZ) , and Ericsson (ERIC) . Because truck and rail activity is a good proxy for the economy, we’ll also be tuning into what J.B. Hunt (JBHT) and CSX (CSX) have to say about things.
Outside of those and other earnings reports coming at us that we’ll “connect the dots” with, we also have a few company investor days and analyst meetings to pay attention to. These include:
Monday, October 14 – General Mills (GIS) Investor Day
Tuesday, October 15 - Brown Forman (BN.B) Investor Day, Salesforce’s (CRM) Investor Day, Hewlett Packard Enterprise’s (HPE) Analyst Meeting, and Dollar Tree’s (DLTR) Investor Day
October 16 - Veeva Systems (VEEV) Investor Day
Here's a closer look at the earnings reports coming at us next week:
Monday, October 13
· Open: Fastenal (FAST)
Tuesday, October 14
· Open: Albertsons (ACI), BlackRock (BLK), Citigroup (C), Domino’s (DPZ), Ericsson (ERIC), Goldman Sachs (GS), Johnson & Johnson (JNJ), Wells Fargo (WFC)
Wednesday, October 15
· Open: Abbot Labs (ABT), ASML (ASML), Bank of America (BAC), First Horizon (FHN), Morgan Stanley (MS), PNC (PNC), Synchrony Financial (SYF)
· Close: J.B. Hunt (JBHT), United Airlines (UAL)
Thursday, October 16
· Open: BNY Mellon (BNY), Charles Schwab (SCHW), Snap-On (SNAP), Travelers (TRV), US Bancorp (USB)
· Close: CSX (CSX), Interactive Brokers (IBKR)
Friday, October 17
· Open: Ally Financial (ALLY), American Express (AXP), Comerica (CMA), Fifth-Thirds Bank (FIBT), State Street (STT), Truist (TFC)
Portfolio Investor Resource Guide
· Economic Data: Here's a List of Links to the Key Economic Data We Closely Watch
· Investing Terminology: 16 Key Terms Club Members Should Know
· 10-Ks: Want to Know About a Stock? Read the Company's Reports
· 10-Qs: Unlock the Numbers and Key Information Behind Your Stock With the 10-Q
· Income Statement: Our Cheat Sheet to Understanding This Financial Document
· Balance Sheet, Cash Flow Statements, and Dividends: How to Know If a Company Is Off-Kilter? Read Its Balance Sheet
· Valuation Metrics: Everyone Wants a Value. Here's How Investors Can Find
· Thematic Investing 101 Webinar
The Portfolio Ratings System
1 - Buy Now (BN): Stocks that look compelling to buy right now.
2 - Stockpile (SP): Positions we would add to on pullbacks or a successful test of technical support levels.
3 - Holding Pattern (HP): Stocks we are holding as we wait for a fresh catalyst to make our next move.
4 - Sell (S): Positions we intend to exit.
Stocks & Markets Podcast Links
Some helpful links if you prefer to catch the podcast on the go, in the car, or wherever. Be sure to give it a like or thumbs up and leave a review if you’re so inclined. We’d appreciate it.
